When I have two sets of test statistics and you want to do a fixed-effect meta-analysis:
library(BiocParallel)
register(MulticoreParam(1, log=TRUE))
bc <- bacon(NULL, es, se)
bc
bcm <- meta(bc)
head(pval(bcm))
print(topTable(bcm))
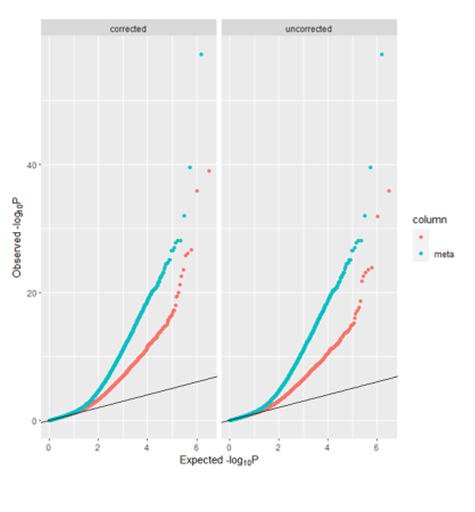
plot(bcm, type="qq")
When I use above code graph qq plot of meta-analysis, there are two qq line in the plot (following figure). Most importantly, My aim was to graph a qq plot with only one qq line which was used to access the similarity between distribution of bacon adjusted p values of meta analysis and empirical null distribution, but I don't know how to do that using ggplo2 packages in R. Can you give some advice?
When I have two sets of test statistics and you want to do a fixed-effect meta-analysis:
library(BiocParallel)
register(MulticoreParam(1, log=TRUE))
bc <- bacon(NULL, es, se)
bc
bcm <- meta(bc)
head(pval(bcm))
print(topTable(bcm))
plot(bcm, type="qq")
When I use above code graph qq plot of meta-analysis, there are two qq line in the plot (following figure). Most importantly, My aim was to graph a qq plot with only one qq line which was used to access the similarity between distribution of bacon adjusted p values of meta analysis and empirical null distribution, but I don't know how to do that using ggplo2 packages in R. Can you give some advice?