Home
pytch is an interactive Python tool with a graphical user interface (GUI) designed to record, process, and visualize multiple singing voices in real time. The GUI displays vocal spectra and estimated F0 trajectories for all singers, as well as the harmonic intervals between them. Additionally, users can adjust visual and algorithmic parameters interactively to accommodate different input devices, microphone signals, singing styles, and use cases.
For install instructions, please see README.md.
If you want to see pytch in action, watch our demo video.
Right after the program start, a startup menu opens:
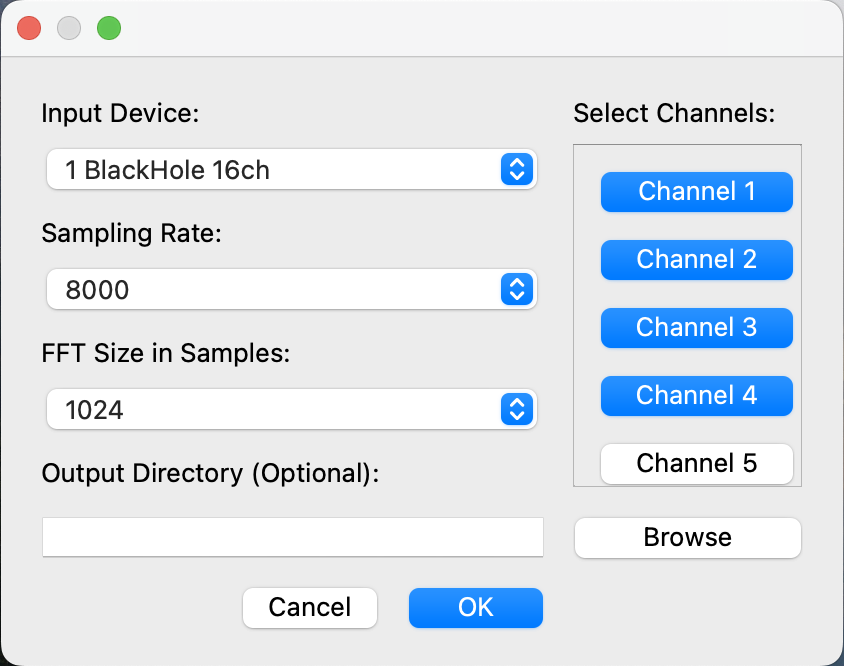
Here, user is asked to specify the soundcard, input channels, sampling rate, and window size for processing. Furthermore, the user can choose to store the recorded audio and the F0 trajectories on disk. These configuration choices are required to initialize the audio processing module and the main GUI, which is loaded when the user clicks "ok". A screenshot of the main GUI which opens after successful initialization is shown in the following figure:
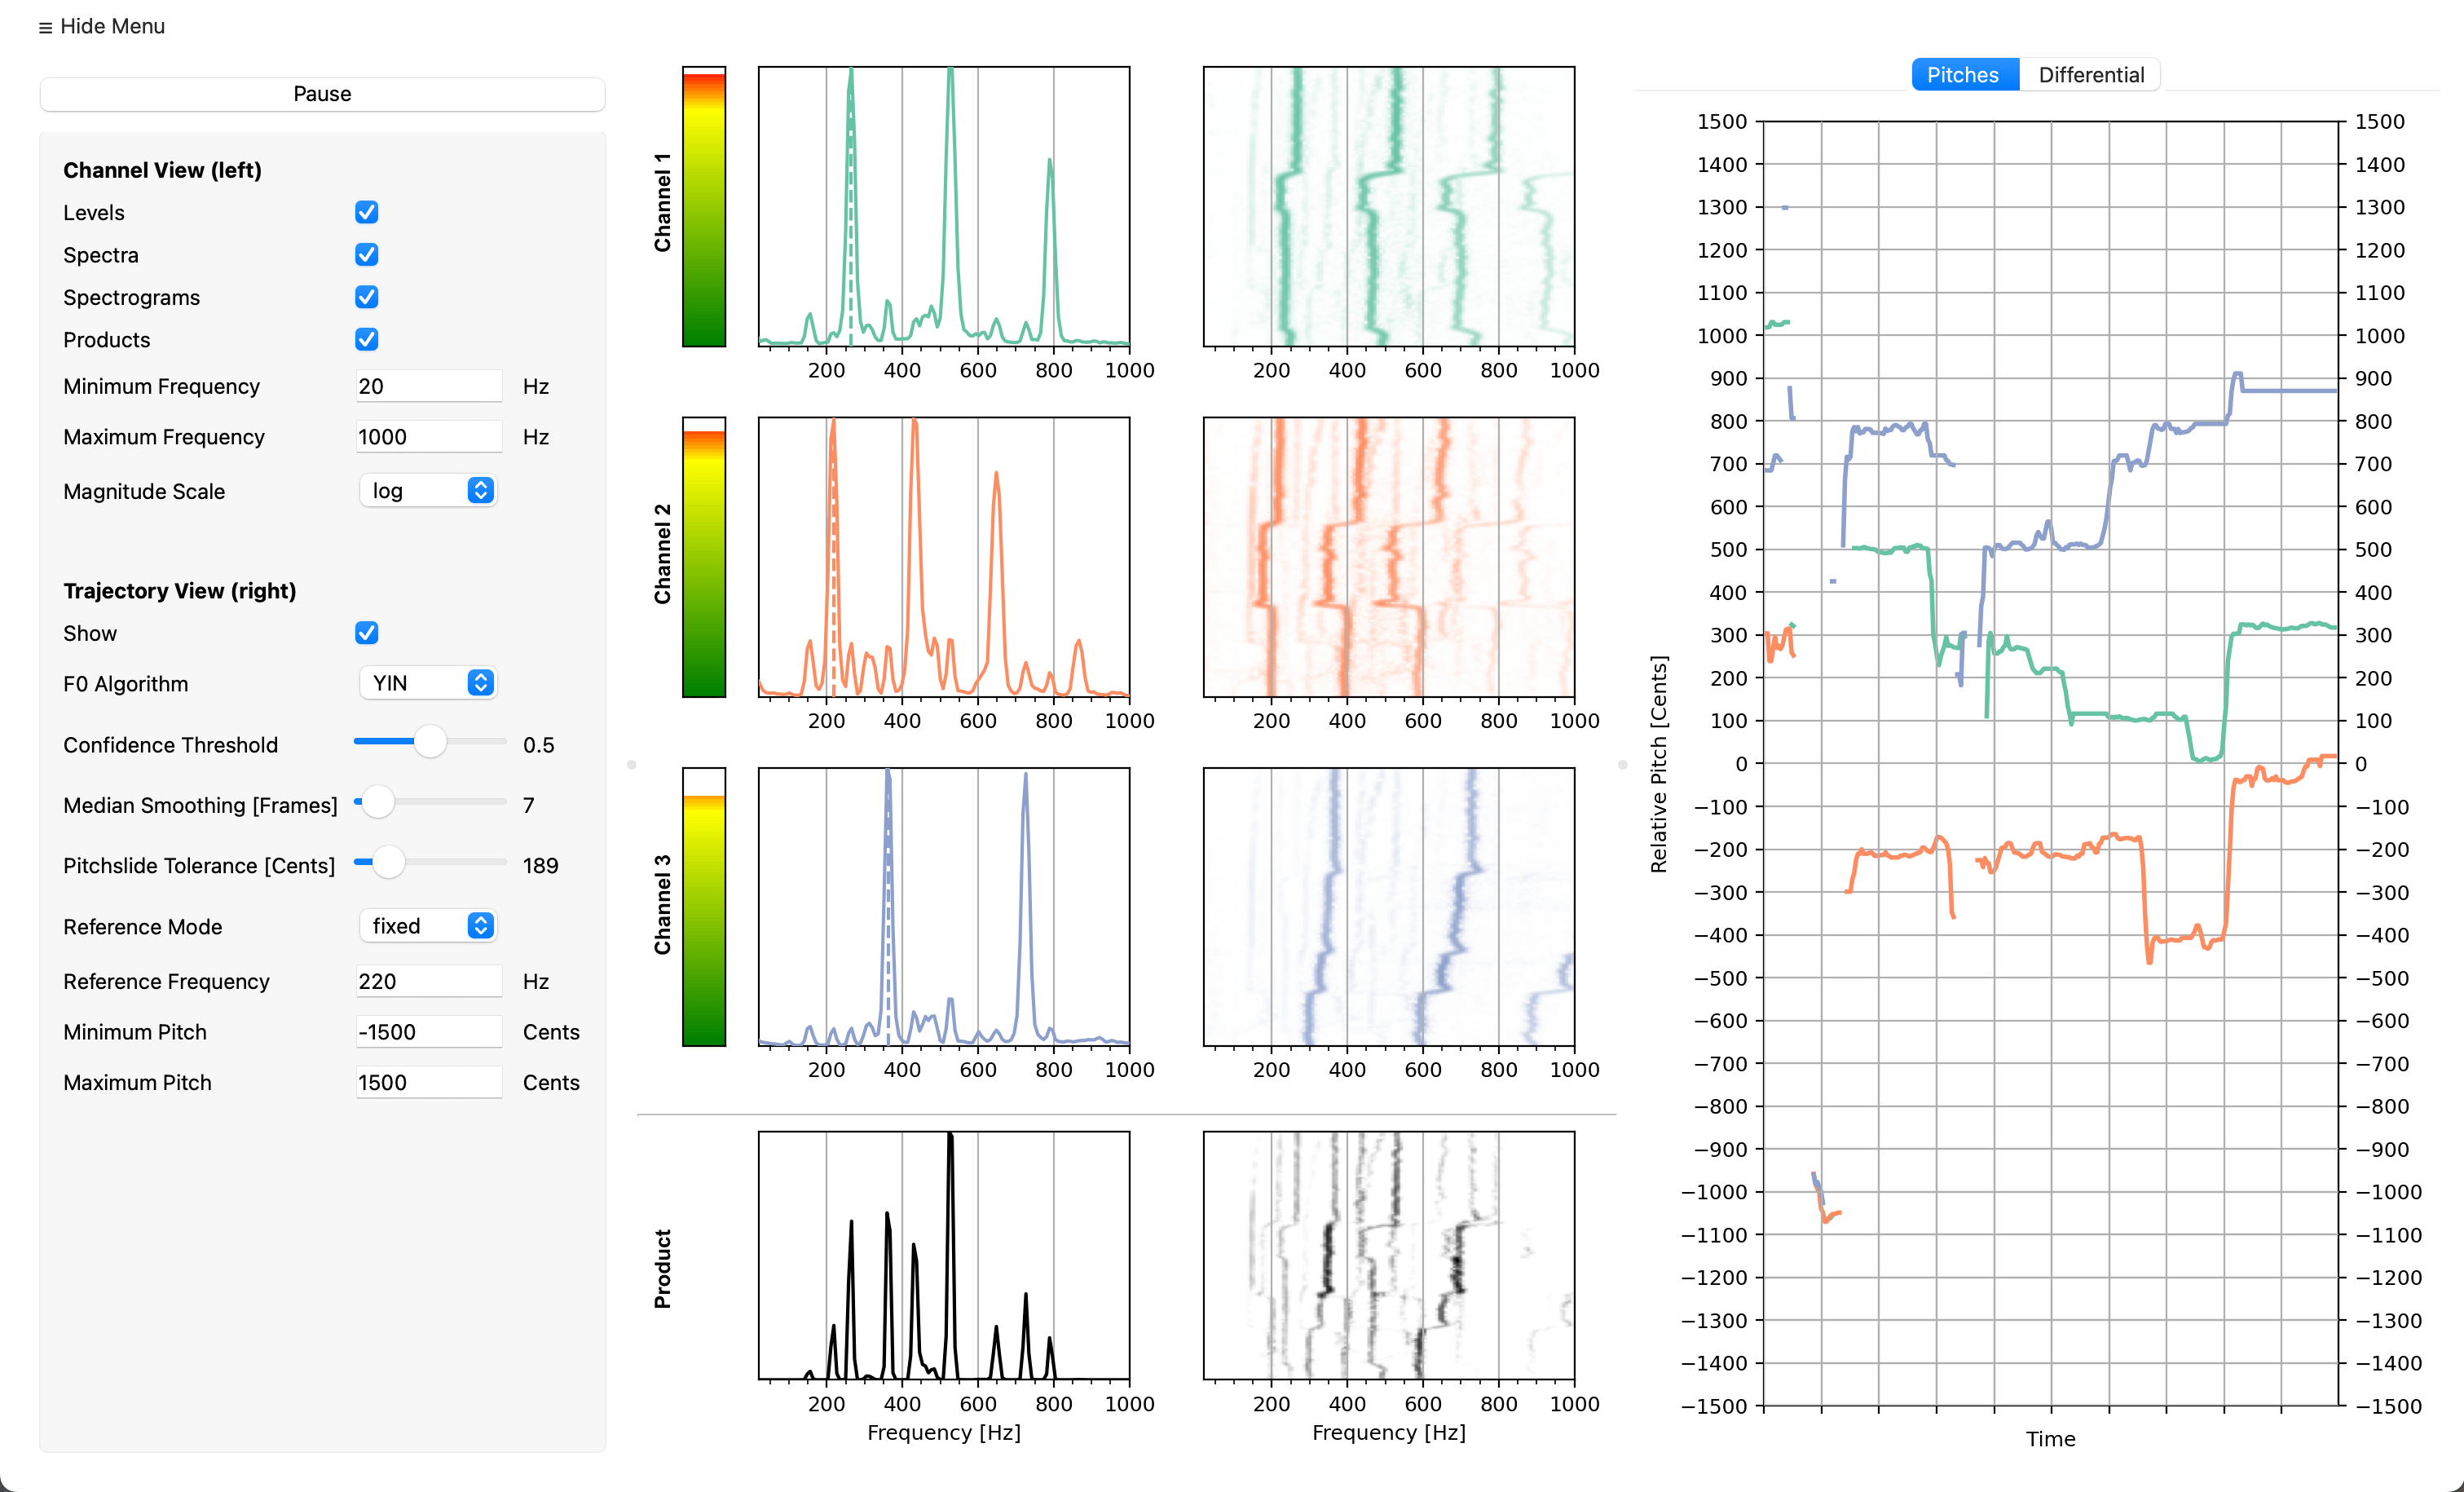
The main GUI is organized into three horizontal sections. On the left, a control panel provides a start/stop button and allows users to adjust both the visual layout and algorithmic parameters. The central section displays "channel views"--one for each input channel--color-coded for clarity. Each view includes a microphone level meter, a real-time spectrum display with a vertical line marking the current F0 estimate, and a scrolling spectrogram with a 5 second time context. Channels are listed from top to bottom in the order they were selected during setup. Optionally, the bottommost view can display a product signal from all channels.
The right section, referred to as the "trajectory view," provides time-based visualizations of either the F0 trajectories ("pitches" tab) or the harmonic intervals between voices ("differential" tab) with a 10 second time context. Using the controls in the left-side menu, the user can select the F0 estimation algorithm and improve the real-time visualization by adjusting the confidence threshold, the median filter length for smoothing, and the tolerance of the gradient filter. F0 and interval trajectories can be displayed with respect to a fixed reference frequency or a dynamic one derived from a selected channel, the lowest, or highest detected voice. Axis limits for this section can also be manually set.