Information Visualization for COVID-19 (Group 14)
- Overview of the COVID-19 pandemic outbreak and spreading in Germany
- Explore the COVID-19 impact on economy over time
- impact on freight transport within germany (rail/road/train/flight)
- impact on German foreign trade (import/export)
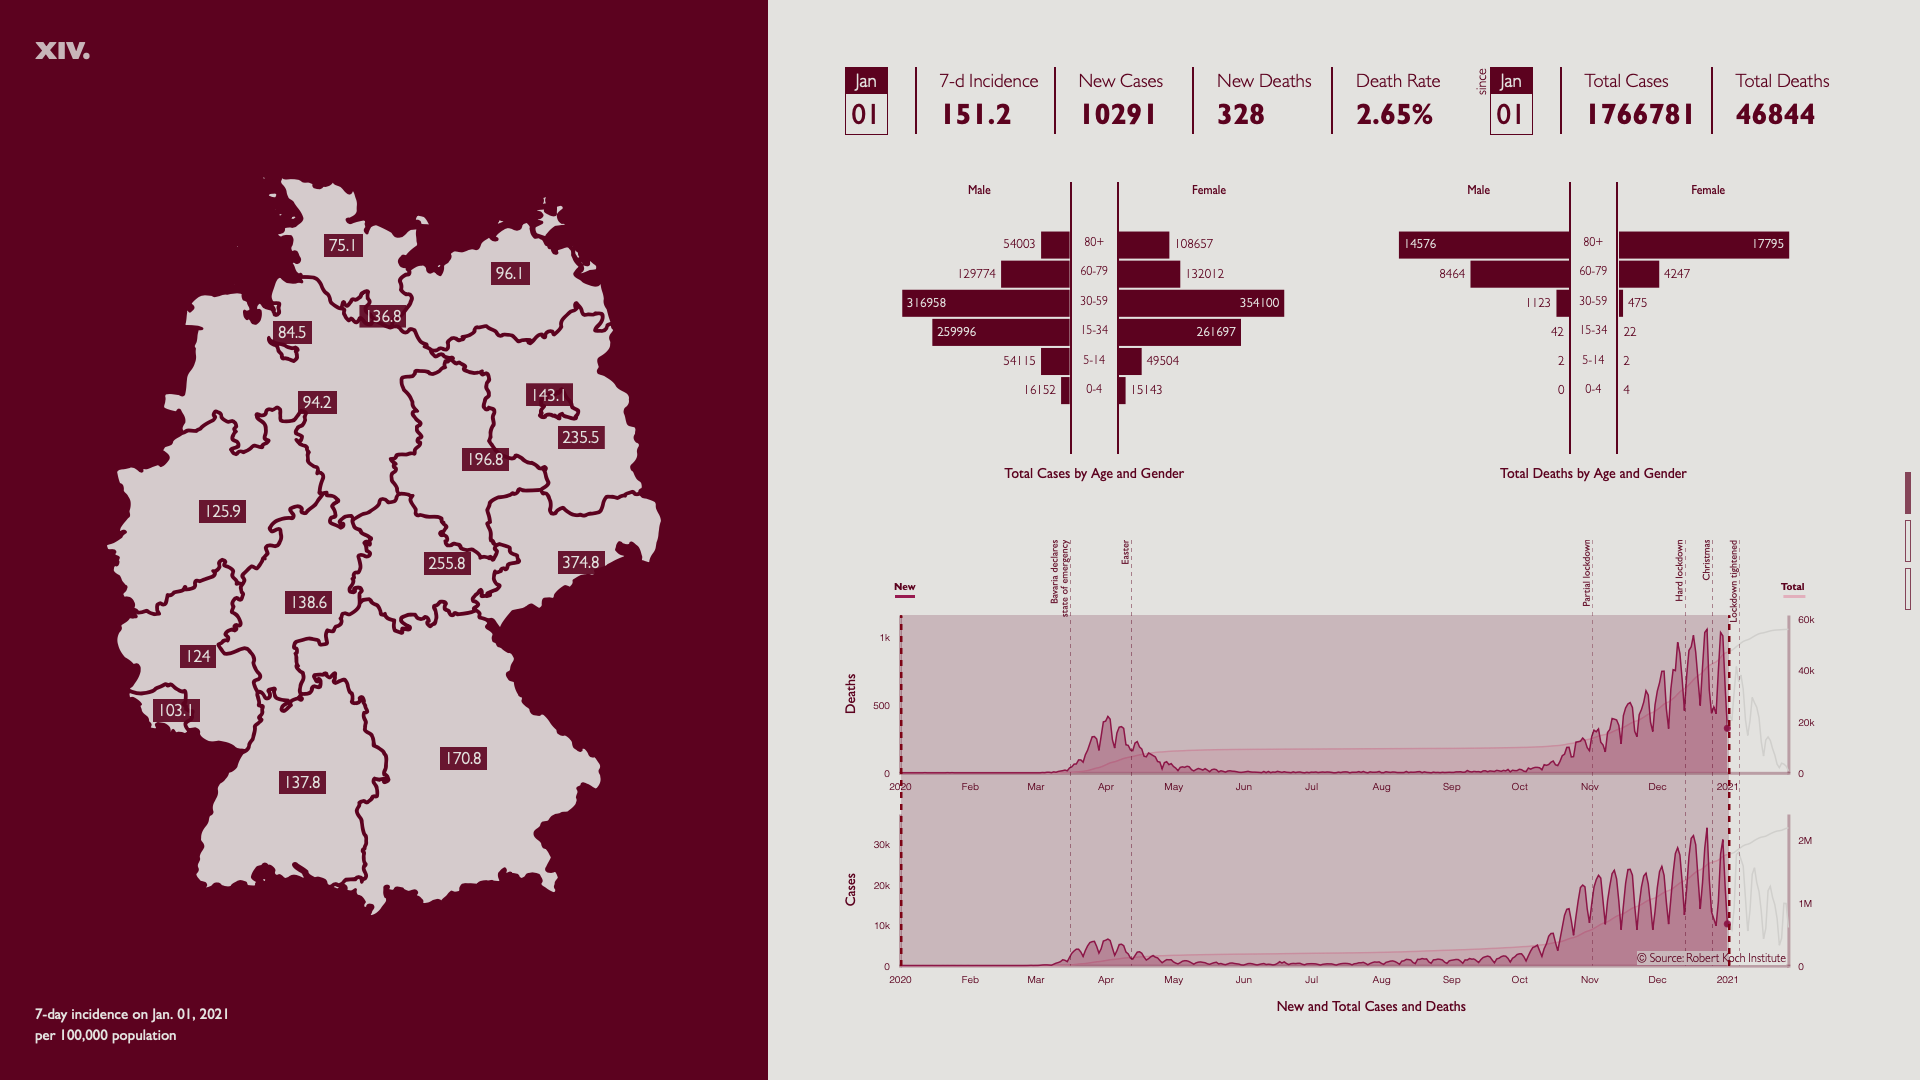
- Overview of basic statistics in Germany (top)
- 7-day incidence on map
- Differences in age and gender (bar charts)
- New/total cases/deaths (line charts)
- Statistics of each state (click on the map)
- Show state name when mouse over
- The coronavirus chronicle:
- date selection (start and end) via range sliders
- all charts refreshed accordingly
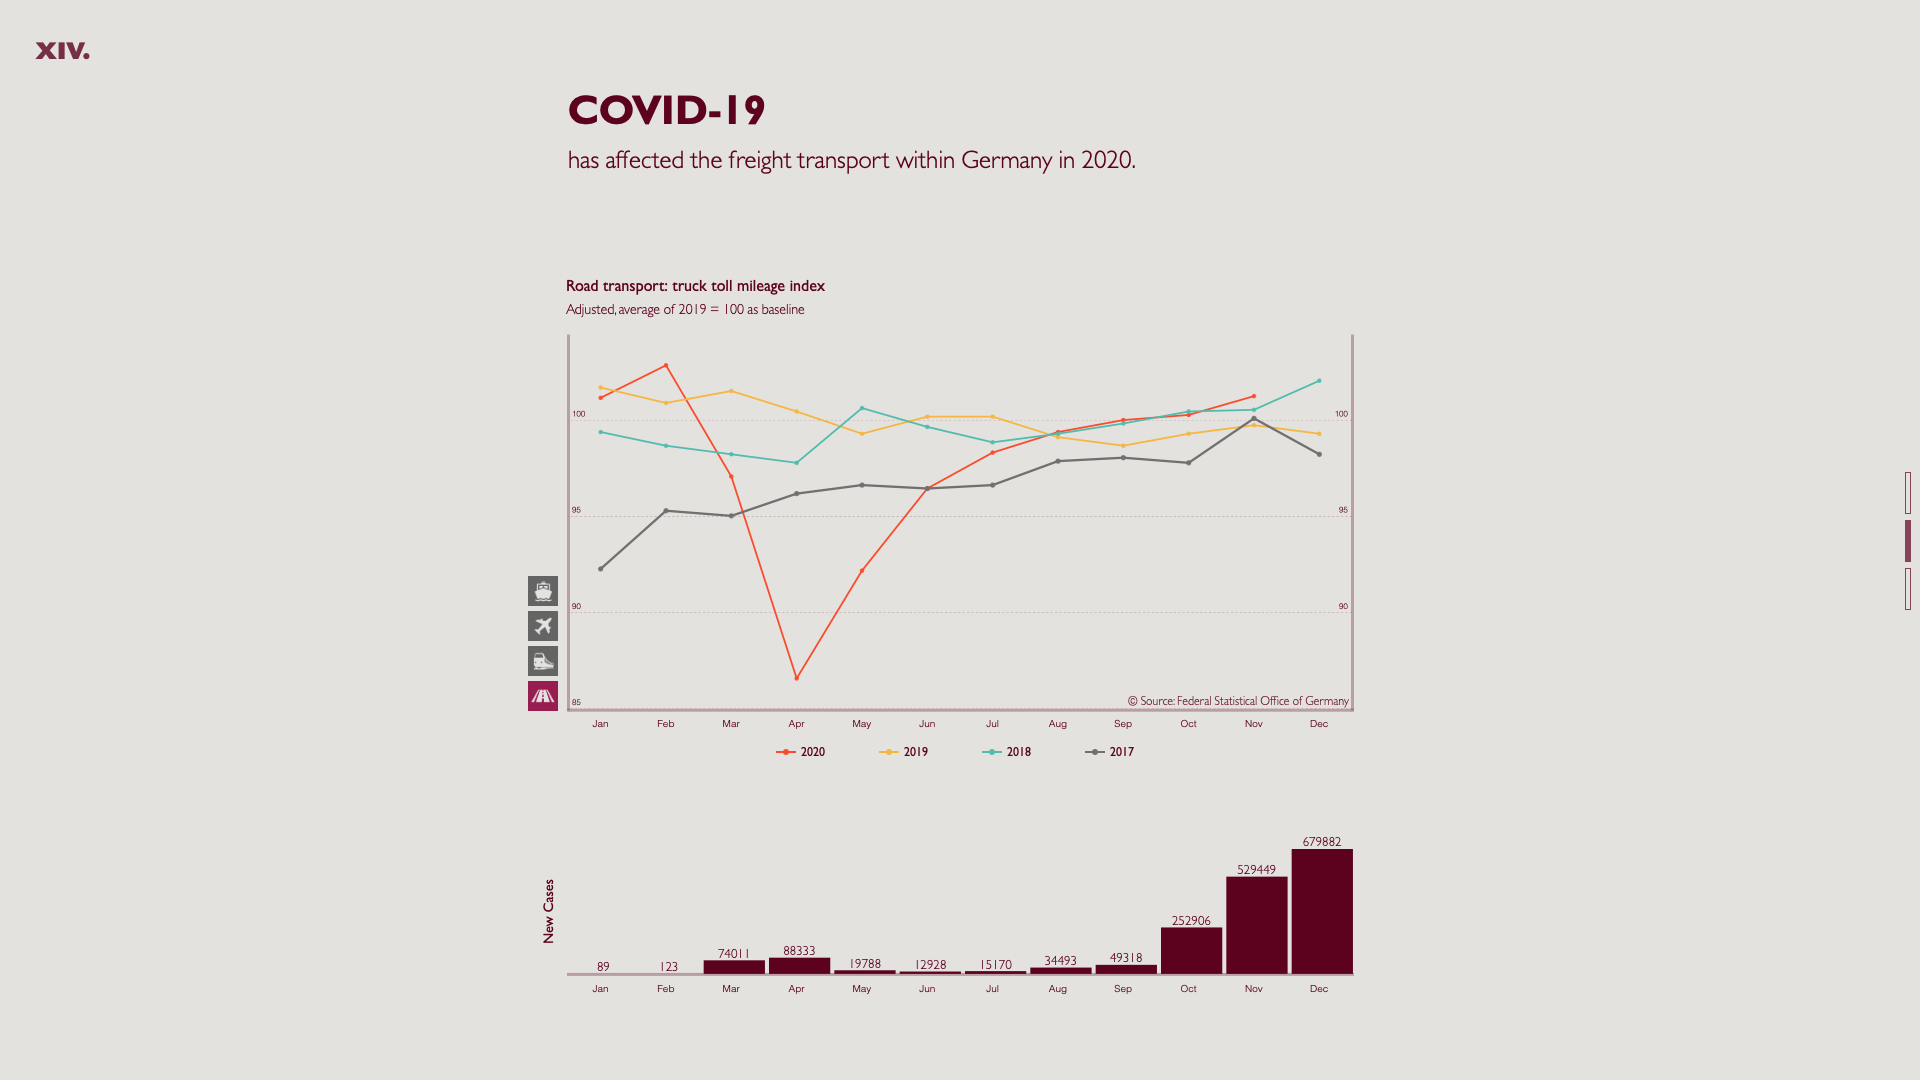
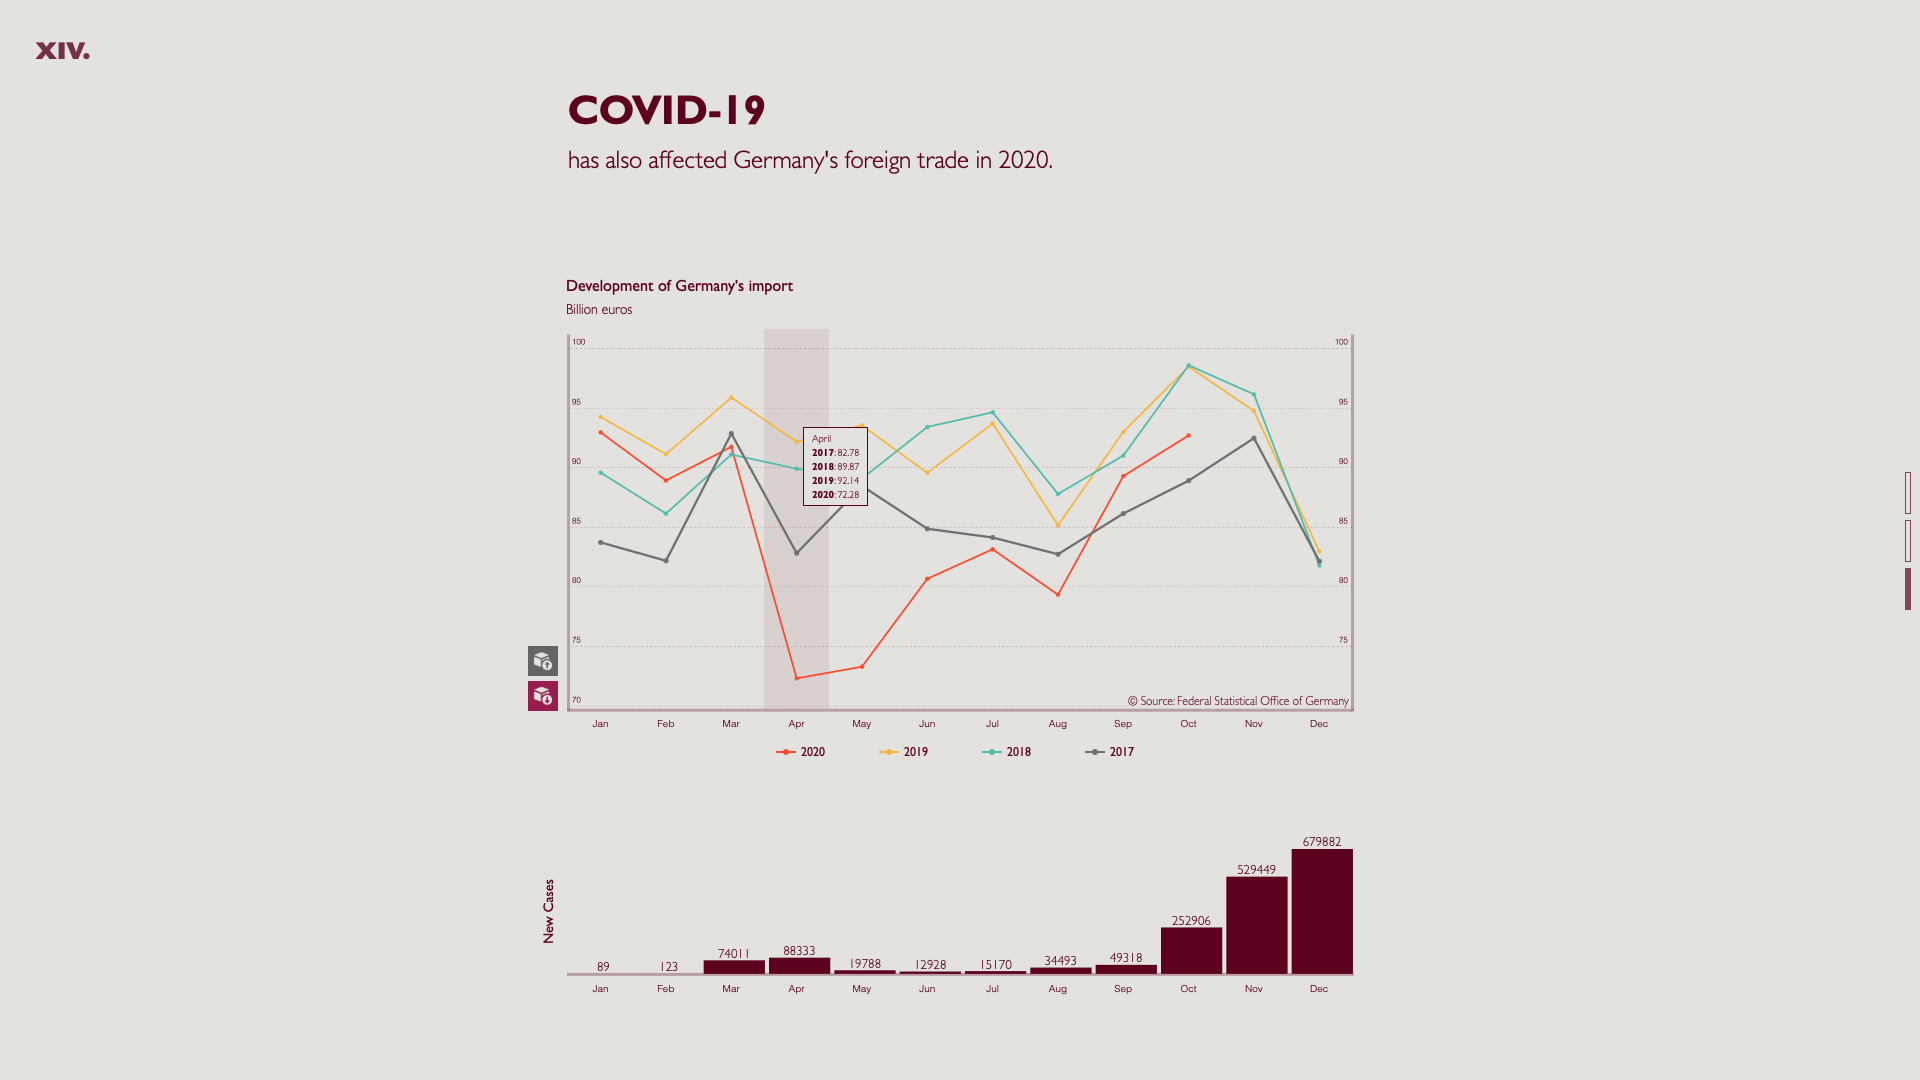
- Freight transport (air/rail/road/waterway) and German's foreign trade (import/export)
- New cases as extra time indicator (bottom)
- Flexible selection of means of transport or import/export (click on the button) and show name when hovering over button
- Highlight a single year when hovering over legend (Line of 2020 will become dashed for comparision)
- Details in tooltip (mouse over)
live demo: https://infovis14.netlify.app/