GENERAL:
Analysis pipeline for handling data collected using the pyPhotometry system during open-field behaviour(s). Animal and object position(s) are passed to the pipeline in .csv files and calcium signals are passed to the pipeline in a .ppd file. Position and signal data are synchronised using an LED sync pulse that is detected as LED intensity in the position data and a digital signal in the photometry data. The first 10 characters should be consistent in the name of the folder containing the data and .csv/.ppd files (ie if folder name is Mouse1_2022-01-01, pipeline will expect Mouse1_2022-01-01.csv and Mouse1_2022-01-01.ppd. See /data for an example of data naming structure,.
Optimised for data collected using the pyPhotometry system: Akam, T., and Walton, M.E. (2019). pyPhotometry: Open source Python based hardware and software for fiber photometry data acquisition. Sci. Rep. 9, 3521. 10.1038/s41598-019-39724-y. Original source code for data import can be found at: https://github.com/ThomasAkam/photometry_preprocessing
Processes the photometry data as described in: Martianova, E., Aronson, S., Proulx, C.D. Multi-Fiber Photometry to Record Neural Activity in Freely Moving Animal.. J. Vis. Exp. (152), e60278, doi: 10.3791/60278 (2019). Original source code for data preprocessing can be found at: https://github.com/katemartian/Photometry_data_processing
OUTPUTS:
Pipeline outputs raw data and dataframe containing timestamps, animal position, and standardised dF/F values. These are saved in .pkl formats.
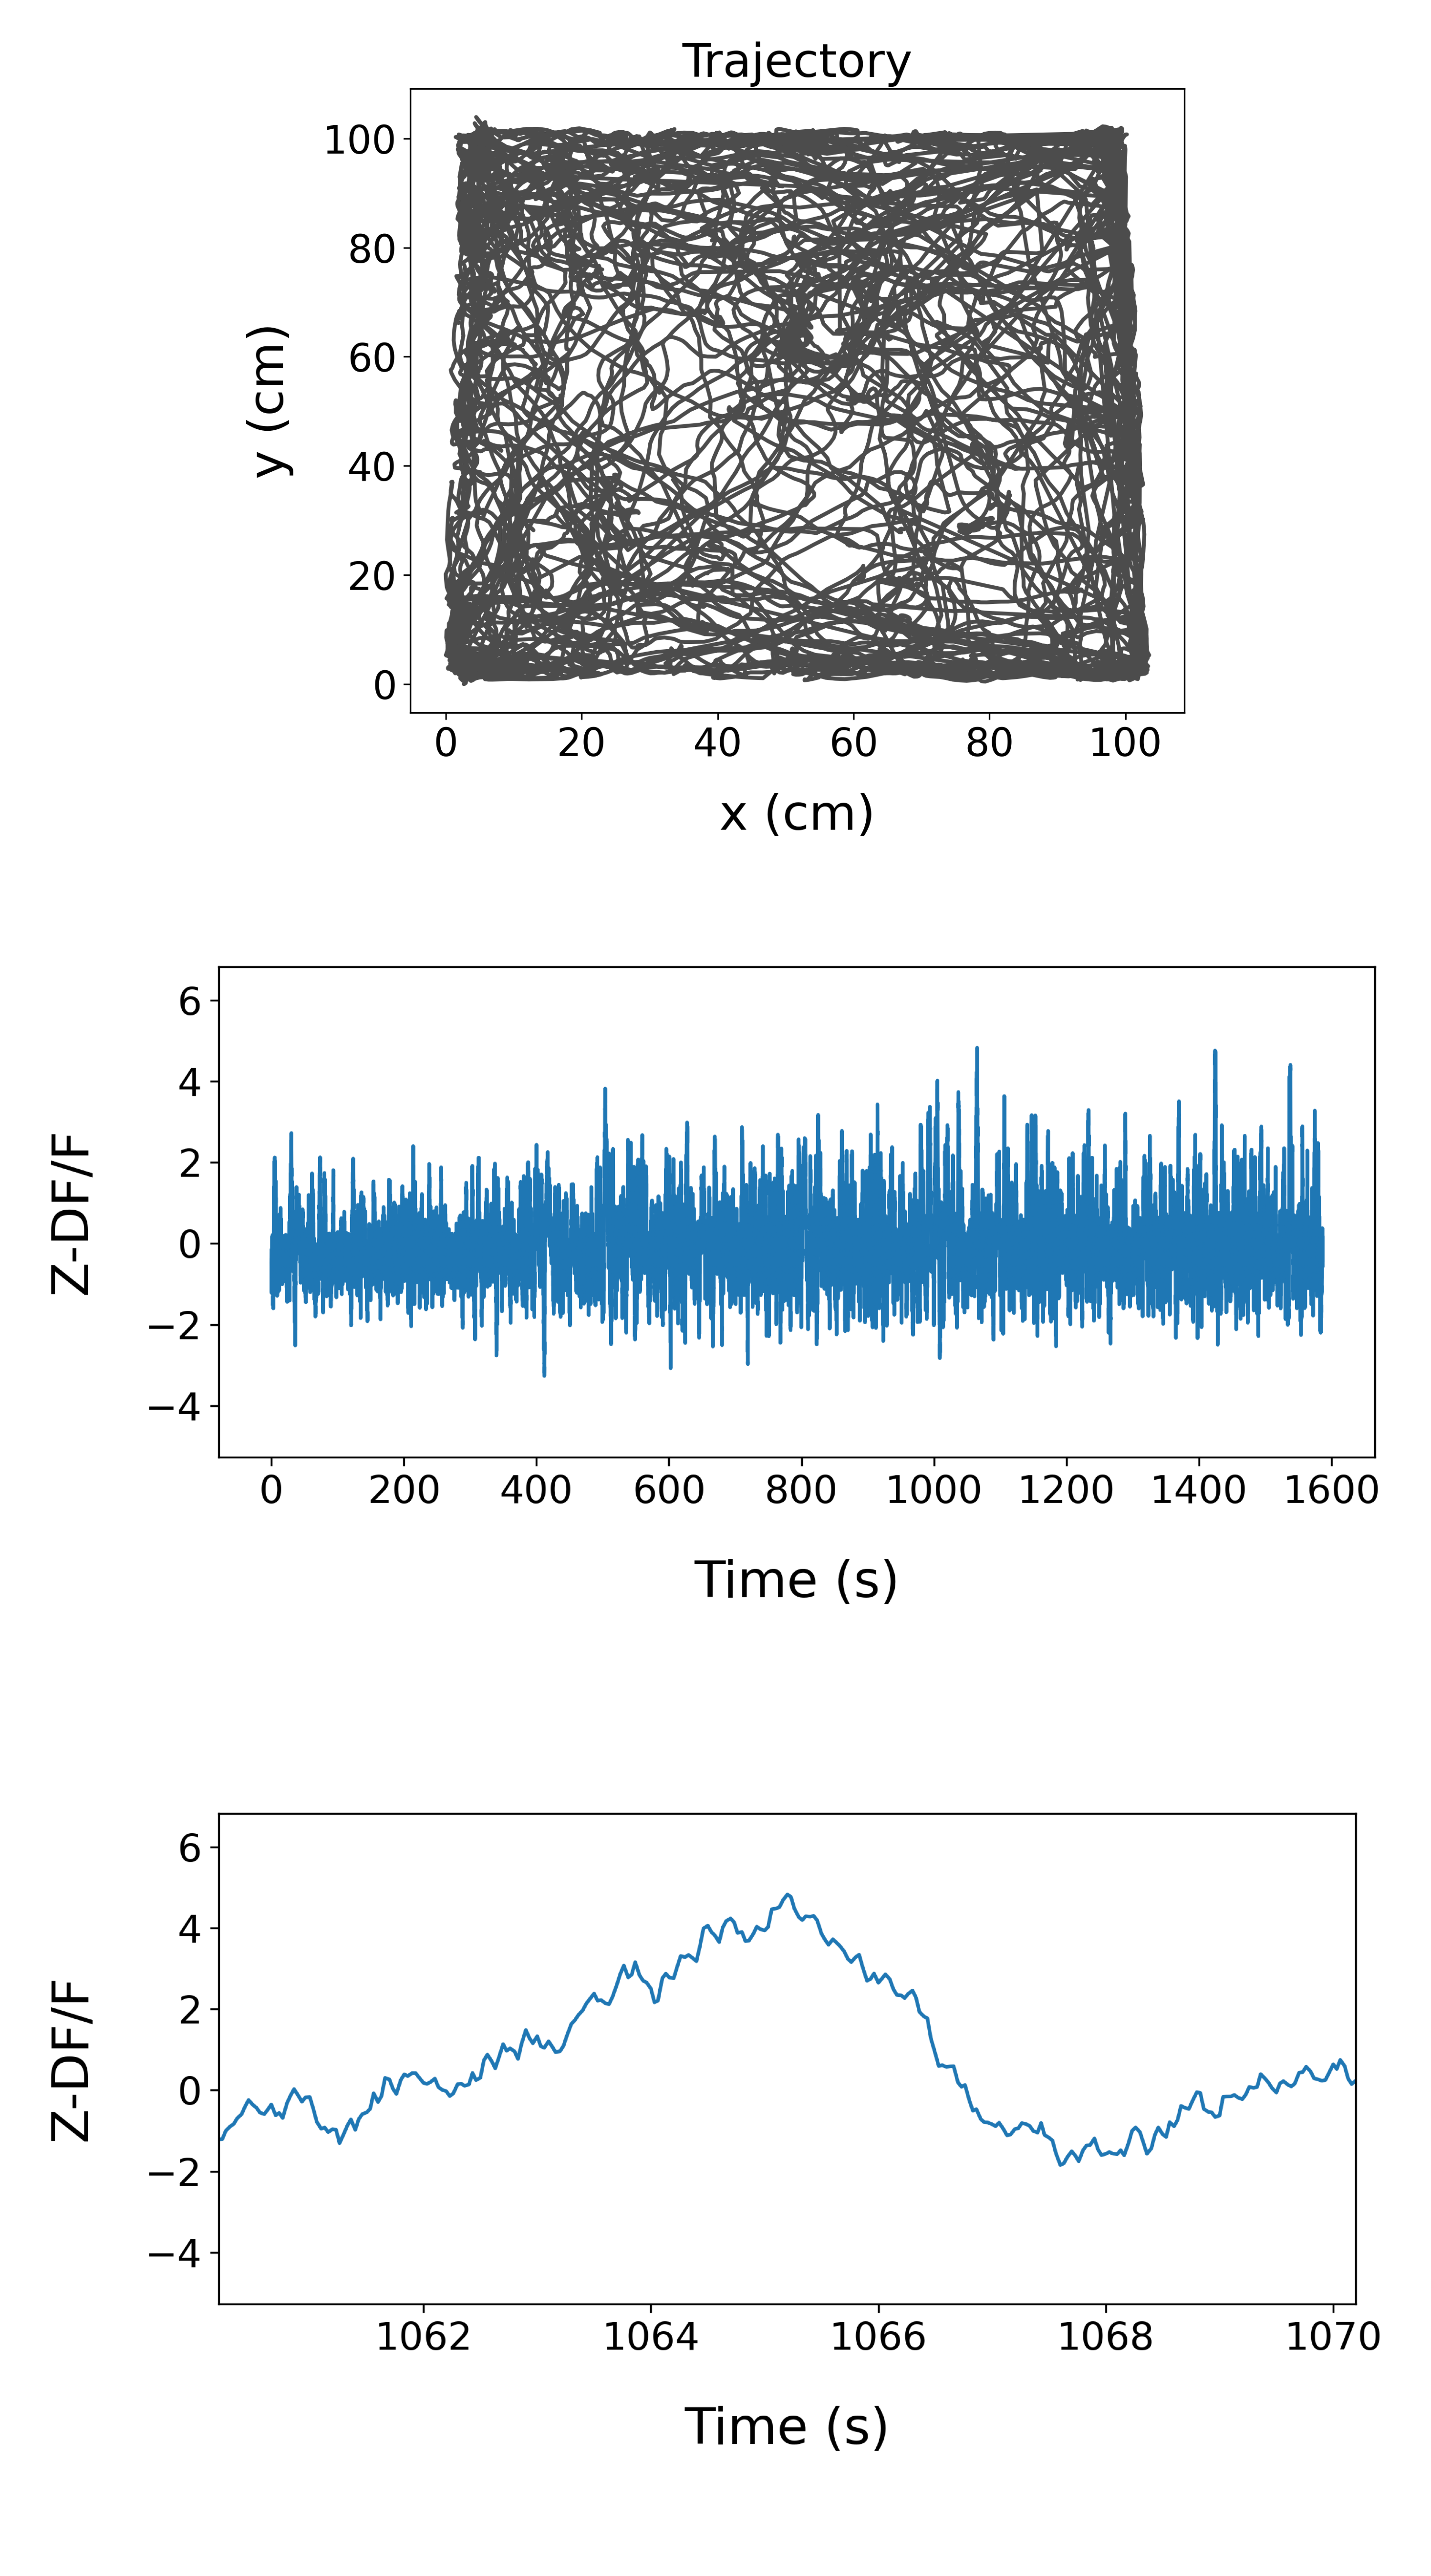
As a default, the pipeline generates figures of animal position and signal (over the whole session and 10s around the signal peak). If animal position data is not available, the pipeline will output figures of signal only.
Example openfield output:
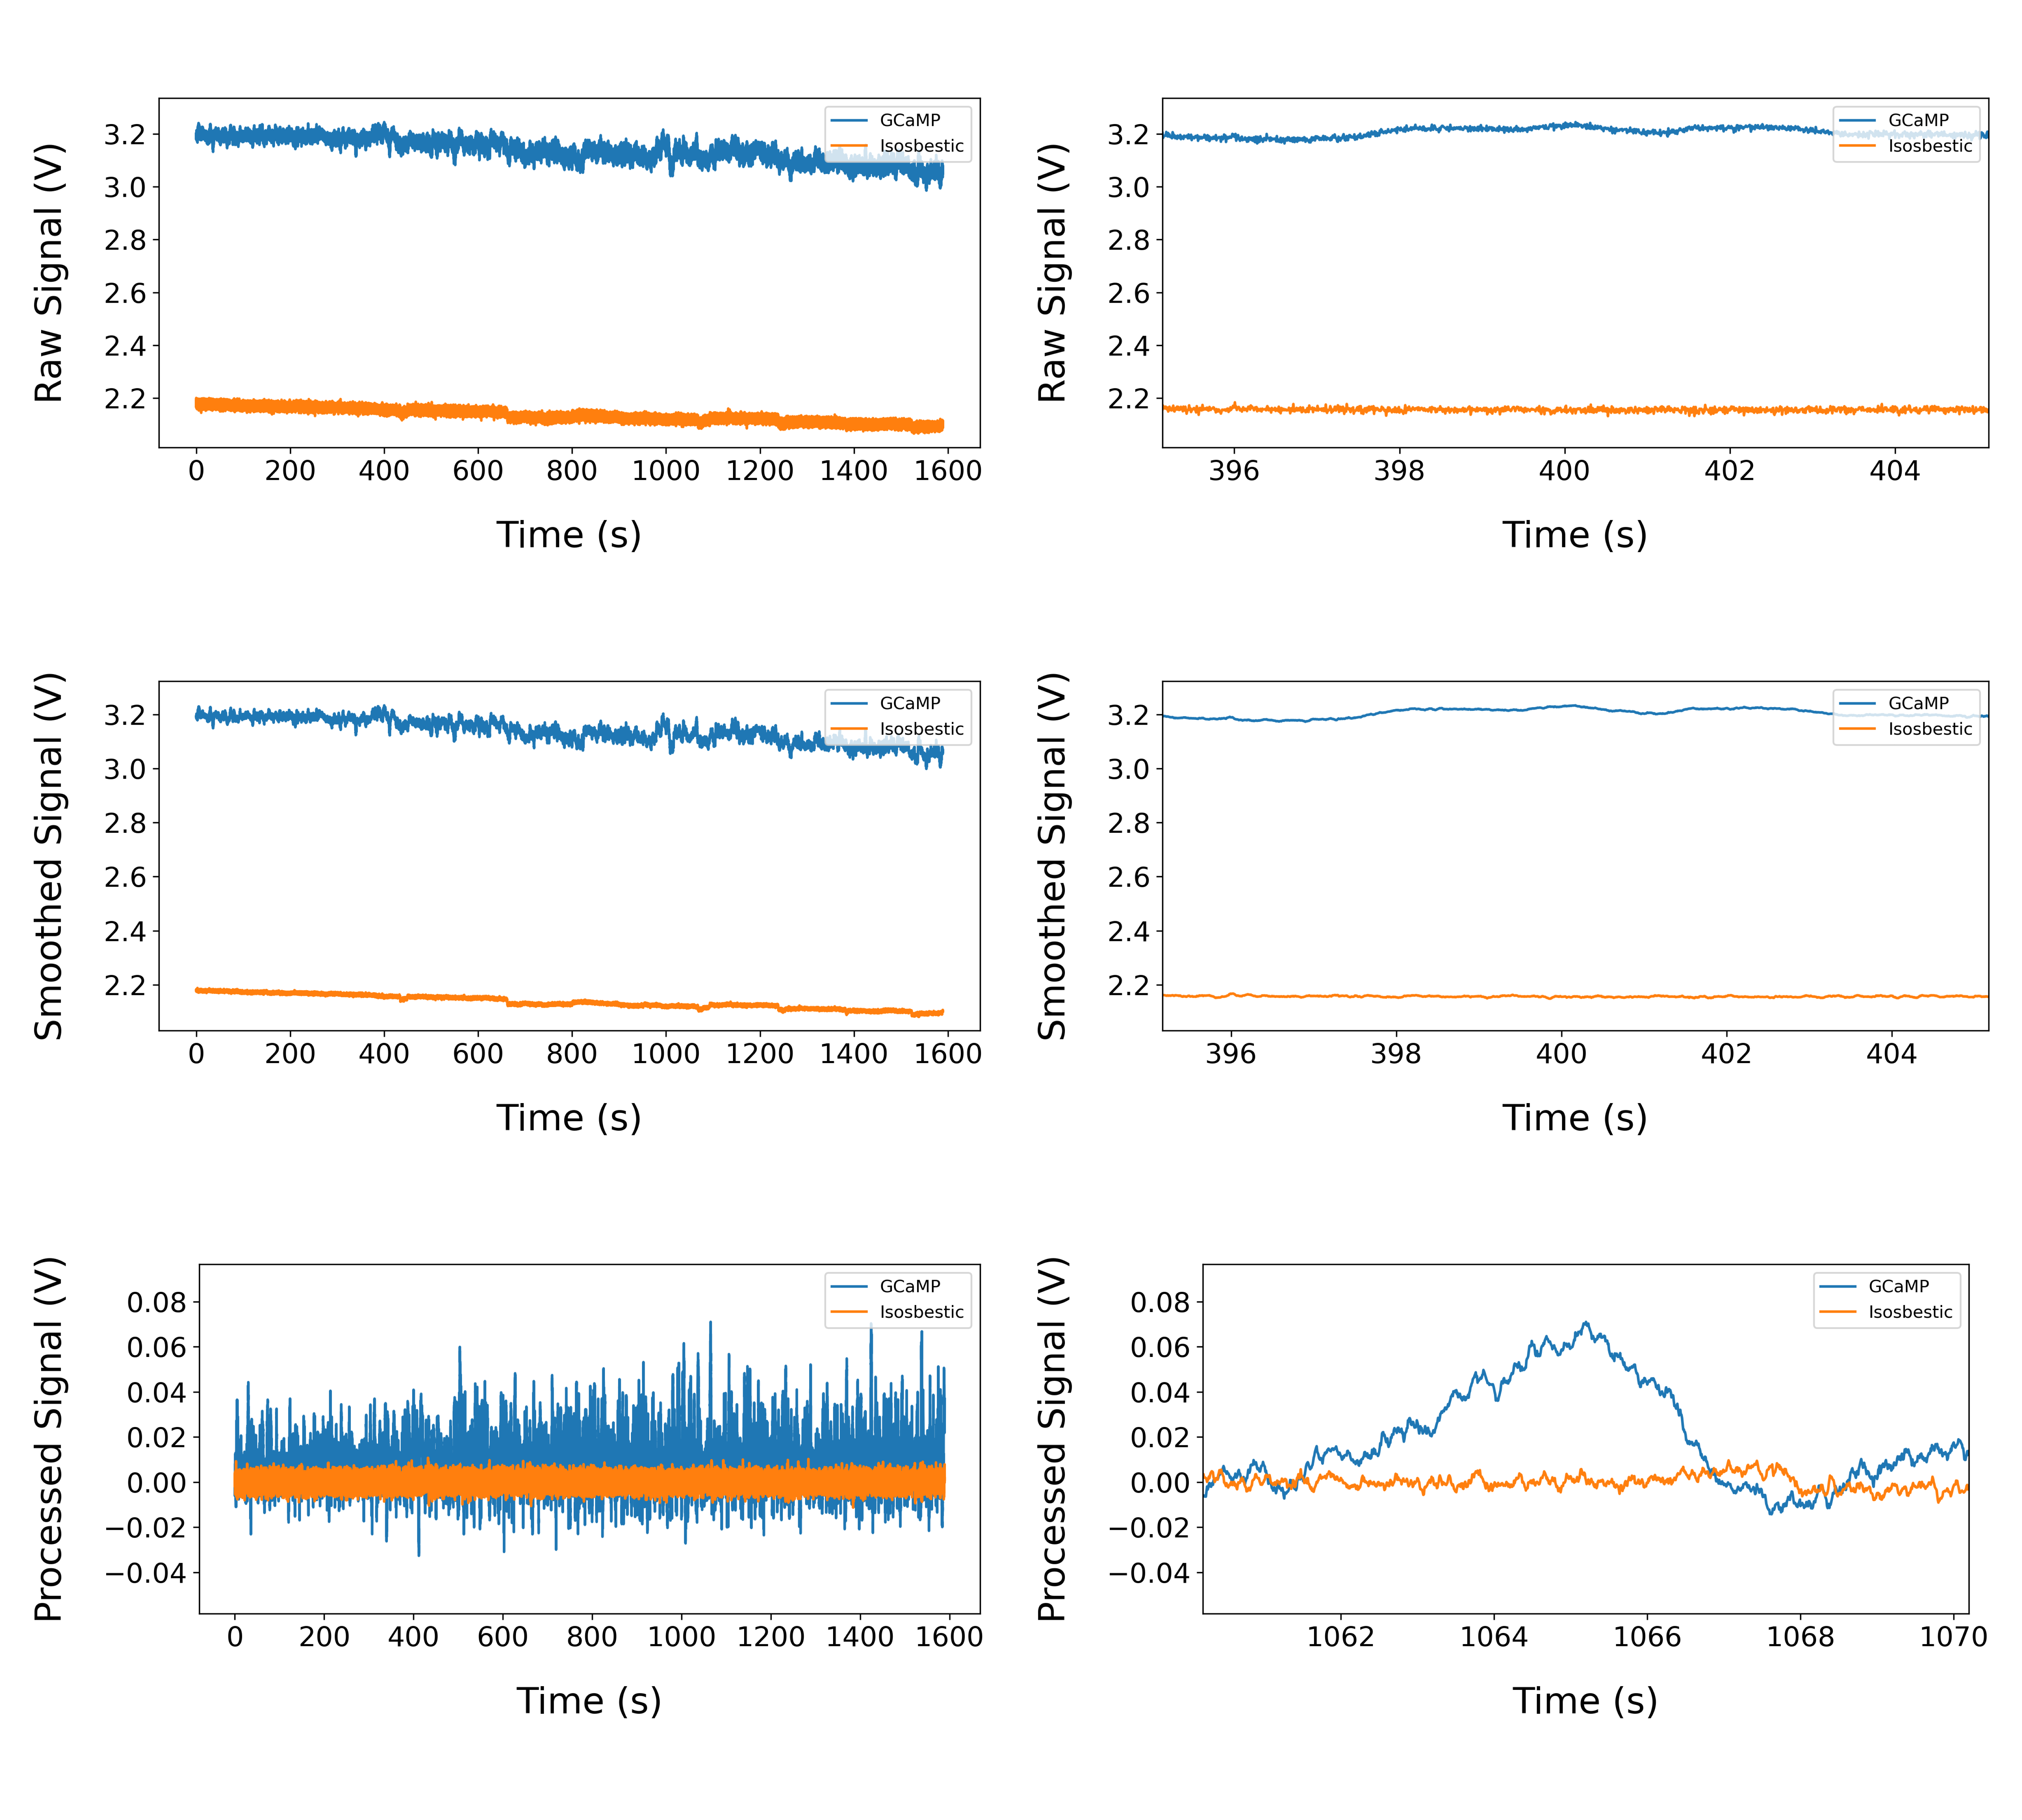
The pipeline also generates a figure showing the signal and reference channels at different stages of preprocessing. Data is shown for the whole session and 10s around the peak for each stage.
Example preprocessing output:
Analysis of session containing objects:
Object positions can be passed to the pipeline in a .csv file generated in Bonsai. If object position(s) are found, bouts of object exploration will be extracted from the data and signal will be plotted in relation to each bout in a heatmap and an average signal trace. These plots will be generated for each object detected. As a default, object bouts are defined as periods where the animal position is <2 cm from the object edge for longer than <0.5 s. Signal is plotted for 2s before and 5s after the object bout begins. Object identity can be passed to the script using the 'item' label in a metdata file (see 'Metadata' below).
Example object session output:
This pipeline also handles sessions where an object is moved (object vector session, see Hoydal et al. 2019). For these sessions, data is split around when the object is moved and the signal around the object is processed separately for each location.
METADATA
You can add a .txt file to the recording folder that contains lines for 'item' and 'session_type'. Multiple lines can be provided for item. Item values correspond to a dictionary of object sizes that are specific to our set up. Items can be added as required.
Accepted values for 'session_type': object, object_vector, odor, odor_vector, object_paired, odor_paired Accepted values for 'item': duck, shaker, truck, gupot, cow, lego, lego1, burger, ball, eggcup, jar
Example of a metadata.txt file for an object_vector session: metadata.txt
HOW TO RUN
-
Download or fork the repository to your machine.
-
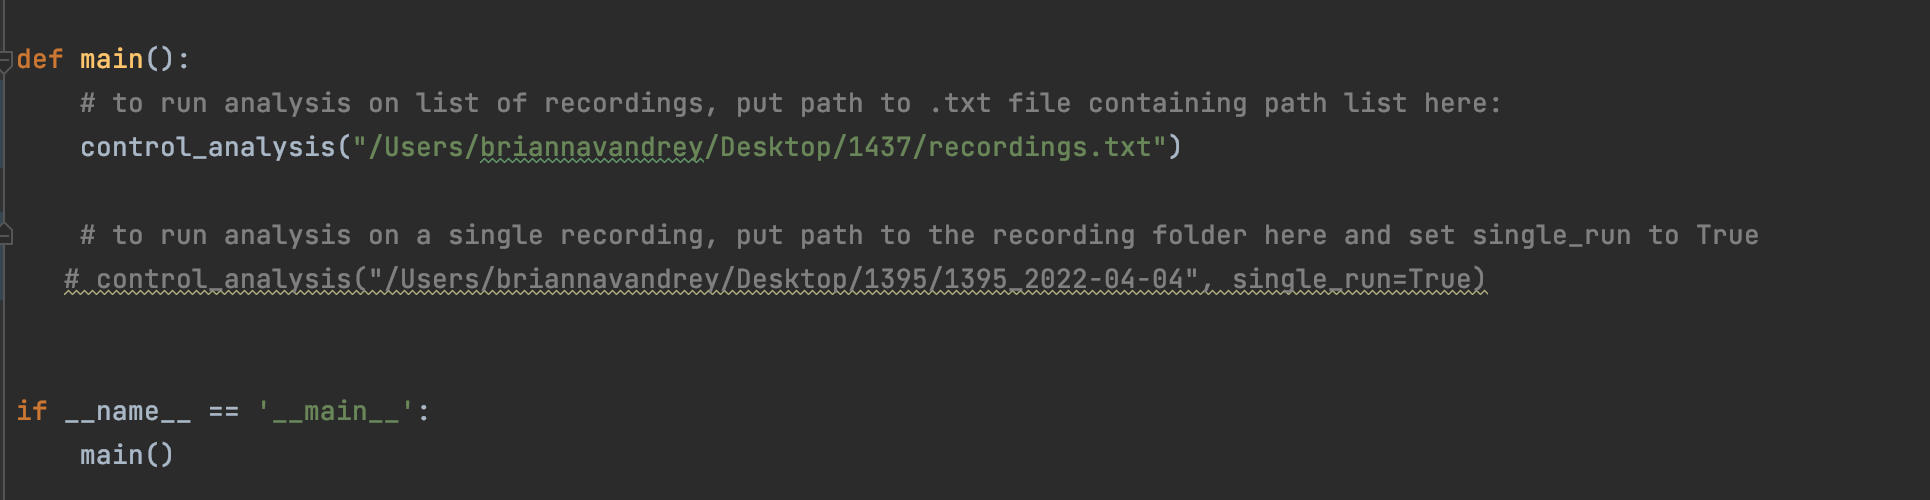
You can run analysis on a list of recordings or on a single recording by running control_analysis.py directly from the main function of your console that is oriented to p and passing it a path to a list of recordings or, if you only want to run one recording, passing it a path directly to a recording folder and setting single_run to True (see below for an example of what this looks like in pyCharm.
Alternatively, you can call that script directly from a the terminal etc. and pass the relevant arguments directly to the function.
Main function in pyphotometry_analysis.py:
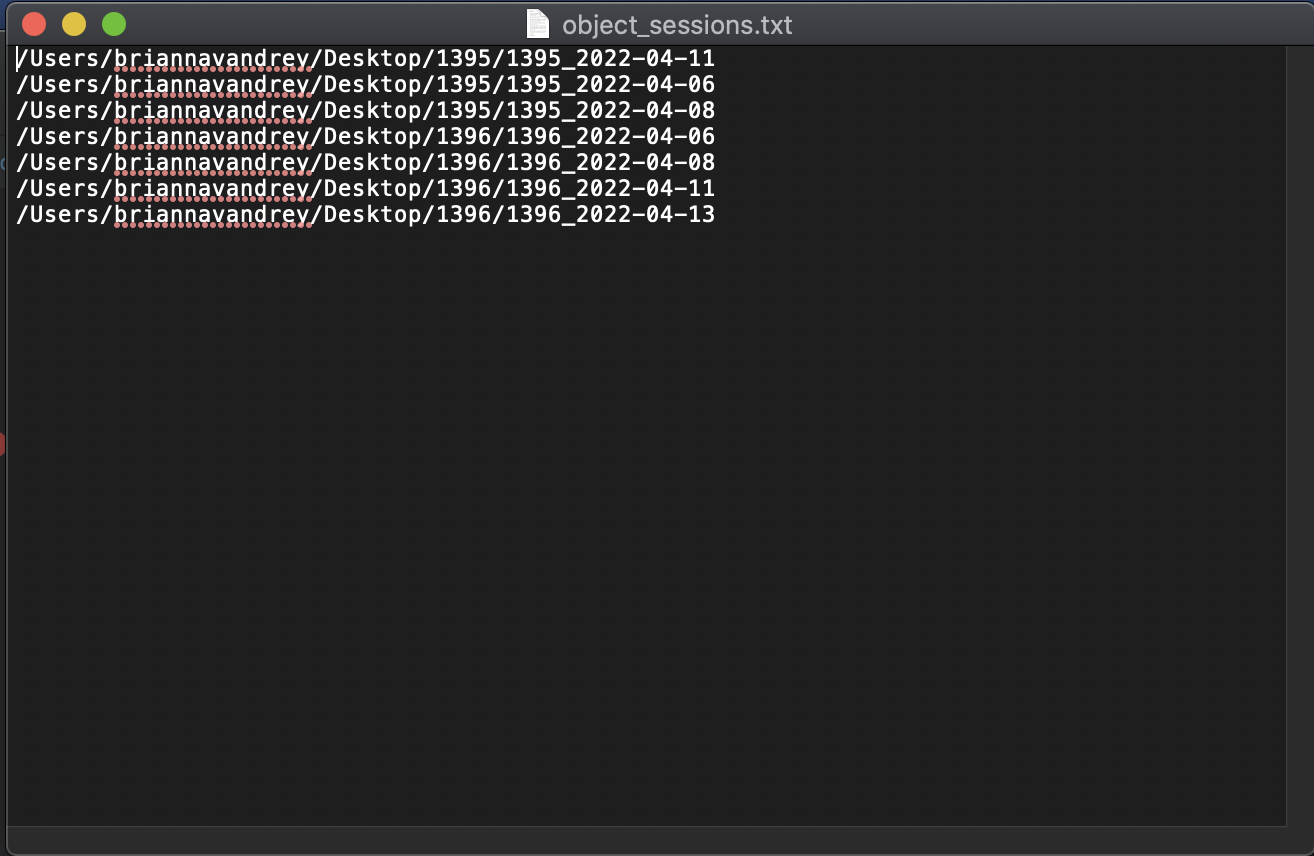
A file containing a list of recordings should have a path for each recording on each line. Ie:
COMMON ERRORS
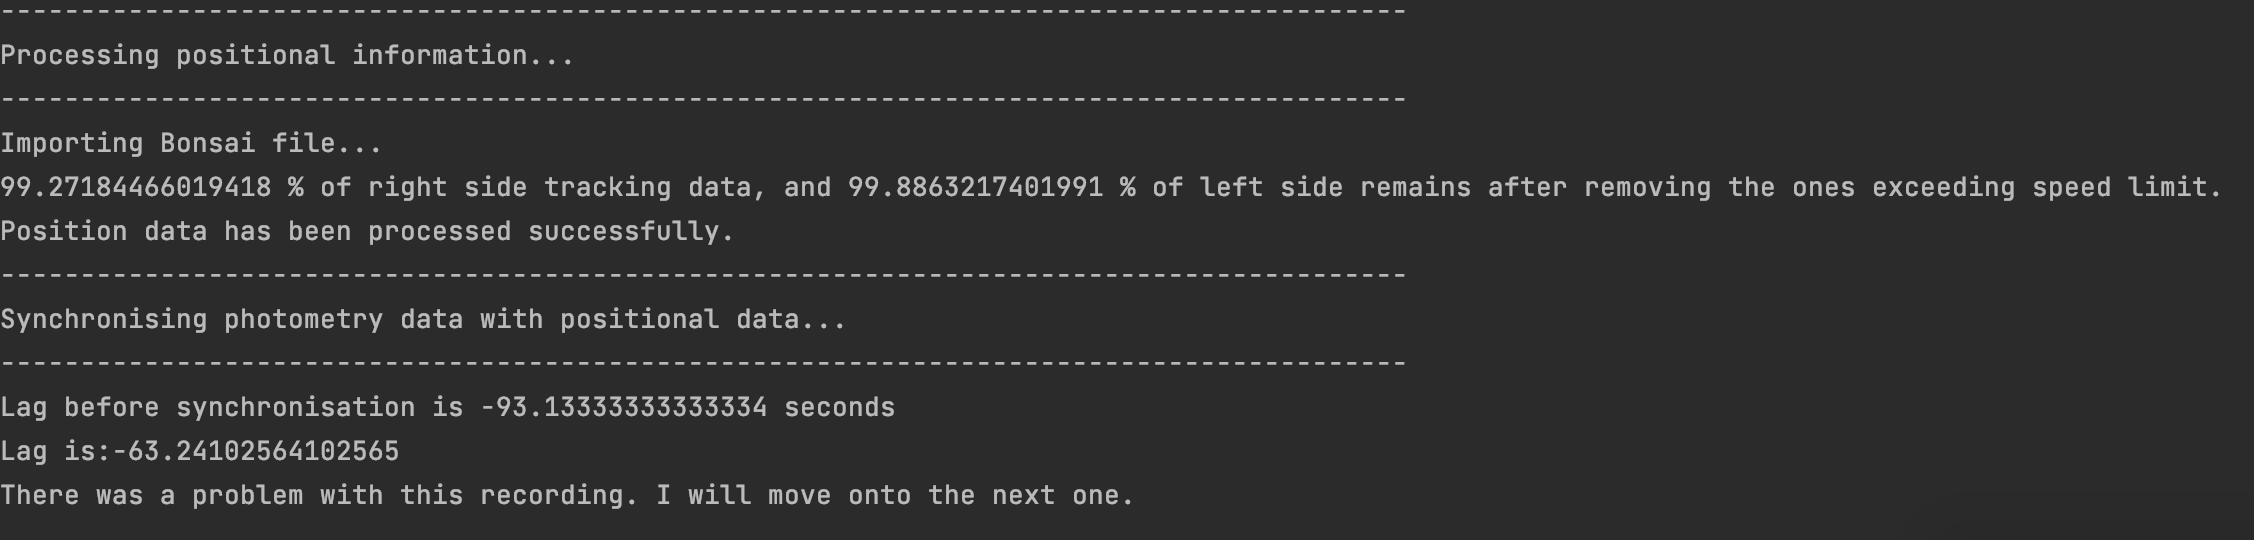
- The Bonsai recording and pyPhotometry recording were started so far apart from one another that they cannot be synchronised. This is probably what happened if your console output looks like this:
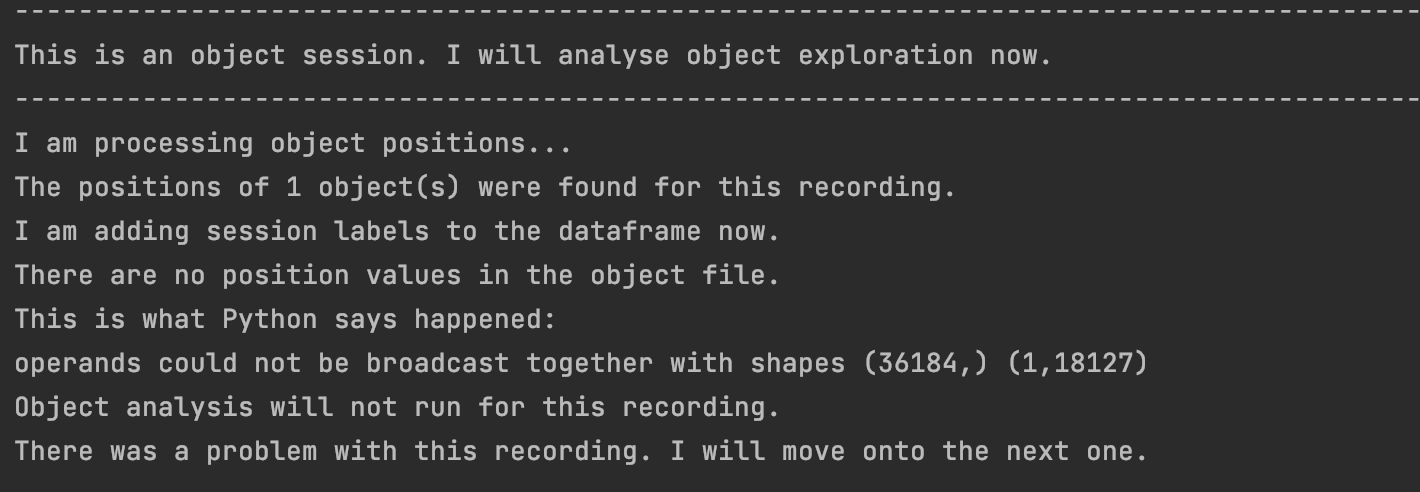
- Your object position file only contains NaNs! (You will also get this if you've included an empty object position file for recordings where there was no object. The pipeline will look at these anyways and yell at you because they are empty. Preprocessing and openfield analysis will still run as normal. This probably happened if your console output looks like this: