Prepare 3 tab format for RNAseq dataset uploading
The following R code goes through preparing a dataset for upload to gEAR using the 3 tab format. If you wish for assistance with the formatting or upload process, please contact our curator team (https://umgear.org/contact.html)
- load in count file
	 countsFileName="count.txt"

		count = read.delim(sep="\t",countsFileName, header=T, check.names=F)

		names(count)[1] = "gene"
		rownames(count) = count$gene
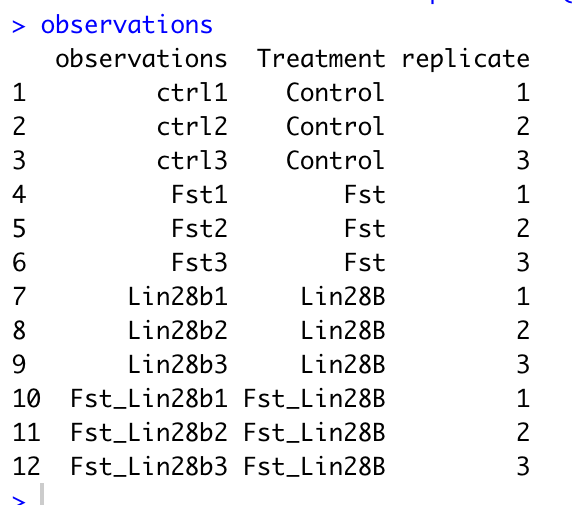
- generate the observation file (this can be done either via code or creating a tab delimited file in Excel.
		options(repr.matrix.max.rows=50, repr.matrix.max.cols=200)

		meta = read.delim("phenotype.txt")


			#re-name the columns, change gender to your variable of interest
			names(obs) = c("observations","genotype", "gender")
Below is an example observation file.
- The first column must be named observations with rows corresponding to your sample names.
- You can add any additional columns that you would like to be able to use for comparison in gEAR.
- If you have replicate samples, to enable all the functionalities of the statistical tools in gEAR, please include a column with the name 'replicate' and values similar to below.
- A column named "replicate", “BioRep”, or “TechRep” is needed for conducting statistic analysis with the comparison tool. The code for adding a replicate column is below, just change the names in the group_by function to match your own column names.
# Adding a replicate column to your dataframe
# Change the variables (e.g. genotype, gender)in group_by to those in your own dataframe.

		obs <- obs %>% group_by(genotype, gender) %>% mutate(replicate = row_number())
		obs = data.frame(obs)
write.table(obs, file= "observation.tab", sep="\t", row.names=F, quote=F)- annotation. check whether there is ensemble in the count file
			temp=count[grepl("ENS",count[,1]),]

			if (nrow(temp)>0) {
 			 print('ensembl ID are detected')

					} else {
  			print('Error: no ensemble detected')}
Here we are using the mouse annotation database, if you wish to use a different database run listDatasets(mart) to get a full list of available annotations.
			library(biomaRT)
                        mart = useMart( 'ensembl' )
			datasets <- listDatasets(mart)
			mart = useDataset( 'mmusculus_gene_ensembl' , mart = mart )
			ensembl = getBM( attributes = c('ensembl_gene_id','external_gene_name') , mart=mart)
			names(ensembl)[2] = "gene_symbol"
			head(ensembl)

	#only keep the first ensemble ID for each gene

			ensembl.m=ensembl[!duplicated(ensembl$gene_symbol),]

	#merge by gene_symbol or ensembl ID

			count.ann = merge(ensembl, count, by.x="gene_symbol", by.y="gene_symbol")

			names(count.ann)[c(2,1)] = c("ensembl_ID", "gene_symbol")


			write.table(count.ann[-1], file= "expression.tab", sep="\t", quote=F, row.names=F)

			genes_to_use=count.ann[c(2,1)]

			write.table(genes_to_use,file= "genes.tab", sep="\t", quote=F,row.names=F)
if the count file is raw count, basic normalization need to be completed before uploading
			count_to_norm=count.ann[-c(1:2)]

			row.names(count_to_norm)=count.ann[,1]

			cpm=sweep(count_to_norm,2,colSums(count_to_norm),FUN="/")*10^6


##quantile normalization of cpm

		quantile_normalisation <- function(df){
  		df_rank <- apply(df,2,rank,ties.method="min")
  		df_sorted <- data.frame(apply(df, 2, sort))
  		df_mean <- apply(df_sorted, 1, mean)
  		index_to_mean <- function(my_index, my_mean){
    	return(my_mean[my_index])}
  		df_final <- apply(df_rank, 2, index_to_mean, my_mean=df_mean)
  		rownames(df_final) <- rownames(df)
  		return(df_final)}

		nq=quantile_normalisation(data.frame(cpm))
		write.table(nq, file=paste(outfile_prefix, "expression.tab", sep = ""), sep="\t", quote=F, row.names=T)
Compress files together for uploading
system( 'tar -czvf upload.tar.gz *.tab')