Vue Chartify is a lightweight and easy-to-use library for creating beautiful and interactive charts with Vue.js. Supports the common chart types, such as line and bar chart and more will be added soon.
- Responsive and adaptive to different screen sizes
- Lightweight, efficient, on-demand binding events
- Customizable colors, fonts, lines, and animation
- Supports Vue 3 and TypeScript
- Use npm:
npm install vue-chartify- Add the css in main.ts
import { createApp } from 'vue'
import App from './App.vue'
import "vue-chartify/style.css"

createApp(App).mount('#app')- Import the component
<script lang="ts">
  import { defineComponent } from 'vue'
  import { VcBarChart, VcLineChart } from 'vue-chartify';
  export default defineComponent({
      components: { VcBarChart, VcLineChart },
      // rest of your component
  })
</script>-
Use the component in template
- Bar Chart
<vc-bar-chart
    data-source="<YourDataSource>"
    argument-field="<YourArgumentField>"
    value-field="<YourValueField>"
    :show-value-axis-line="true"
    :show-argument-axis-line="true"
    :show-value-titles="true"
    :show-argument-titles="true"
    :show-value-labels="true"
    :show-horizontal-grid-lines="true"
    :show-vertical-grid-lines="true"
    :bar-colors="['#454d66', '#309975', '#58b368', '#dad873', '#efeeb4', '#454d66', '#309975']"
    bar-color="red"
    :bar-radius="5"
    :animation="true"
/>
- Line Chart
<vc-line-chart
    data-source="<YourDataSource>"
    argument-field="<YourArgumentField>"
    value-field="<YourValueField>"
    :show-value-axis-line="true"
    :show-argument-axis-line="true"
    :show-value-titles="true"
    :show-argument-titles="true"
    :show-value-labels="true"
    :show-horizontal-grid-lines="true"
    :show-vertical-grid-lines="true"
    line-color="#343090"
    :line-width="3"
    :animation="true"
    :show-points="true"
/>
* = required
| Name | Type | Default | Description |
|---|---|---|---|
| dataSource * | Object[] | [] | Binds the UI component to data |
| argumentField * | String | undefined | Specifies which data source field provides arguments for series points |
| valueField * | String | undefined | Specifies which data source field provides values for series points |
| width | String | 100% |
Specifies the width of the UI component |
| height | String | 500px |
Specifies the height of the UI component in pixels.edges |
| showValueLabels | Boolean | false |
Shows the value as label on data points |
| showArgumentTitles | Boolean | true |
Shows the argument (x-axis) titles |
| showValueTitles | Boolean | true |
Shows the value (y-axis) titles |
| showValueAxisLine | Boolean | true |
Shows the value axis (y-axis) line |
| showArgumentAxisLine | Boolean | true |
Shows the argument axis (x-axis) line |
| showHorizontalGridLines | Boolean | false |
Shows the horizontal grid |
| showVerticalGridLines | Boolean | false |
Shows the vertical grid lines |
| horizontalGridLineOptions | Object | {stroke: '#dddddd80', 'stroke-width': '1px'} |
Specifies the horizontal grid lines style |
| verticalGridLineOptions | Object | {stroke: '#dddddd80', 'stroke-width': '1px' |
Specifies the vertical grid lines |
| fontSize | String | 12px |
Specify font size value |
| fontColor | String | black |
Specify font color |
| fontFamily | String | Arial, Helvetica, sans-serif |
Specify font family |
| animation | Boolean | true |
Enables the animation in the UI component |
| animationDuration | String | 0.5s |
Specifies how long the animation runs |
| breakpoints | Object | Breakpoints | Specifies breakpoints for chart responsiveness |
| customValueLabel | Function | (value: number, index: number) => value |
Custom value label function |
- Bar Chart Props
| Name | Type | Default | Description |
|---|---|---|---|
| barColor | String | black |
Specifies bar colors |
| barColors | String[] | [] |
Specifies color for each specific bar |
| barRadius | Number | 0 |
Specifies bar radius value |
- Line Chart Props
| Name | Type | Default | Description |
|---|---|---|---|
| lineColor | String | black |
Specifies line color |
| lineWidth | Number | 3 |
Specifies width value of the line |
| showPoints | Boolean | true |
Show the points |
The default object of Breakpoints has the following properties. The gap value determines the spacing and affects their sizes.
{
    xs: {
        width: '576px',
        gap: '20px'
    },
    sm: {
        width: '768px',
        gap: '22px'
    },
    md: {
        width: '992px',
        gap: '25px'
    },
    lg: {
        width: '1200px',
        gap: '27px'
    },
    xl: {
        width: '1400px',
        gap: '30px'
    }
}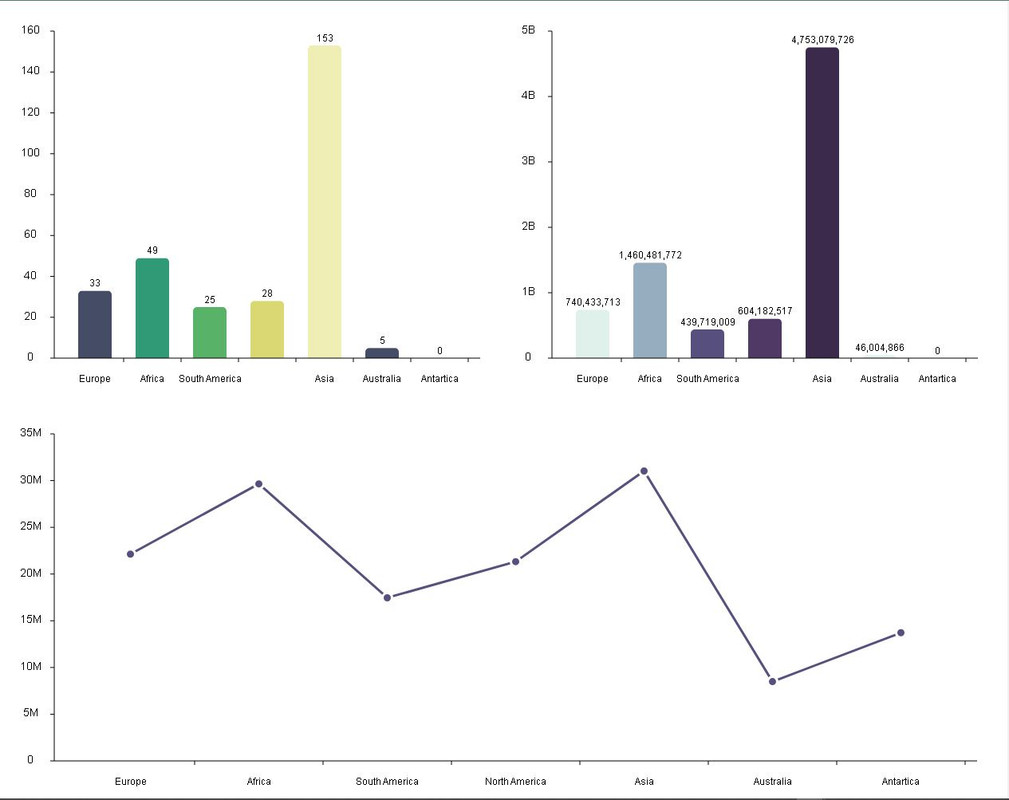
<template>
  <div>
    <div class="bar-charts">
      <vc-bar-chart
        :data-source="dataSource"
        argument-field="continent"
        value-field="density"
        :bar-colors="['#454d66', '#309975', '#58b368', '#dad873', '#efeeb4', '#454d66', '#309975']"
        :bar-radius="5"
        :animation="true"
        :custom-value-label="getValueLabel"
        show-value-labels
        @bar:click="onBarClick"
      />
      <vc-bar-chart
        :data-source="dataSource"
        argument-field="continent"
        value-field="population"
        :bar-colors="['#e0f0ea', '#95adbe', '#574f7d', '#503a65', '#3c2a4d', '#e0f0ea', '#95adbe']"
        :bar-radius="5"
        :animation="true"
        show-value-labels
        :custom-value-label="getValueLabel"
        @bar:click="onBarClick"
      />
    </div>
    <vc-line-chart
      :data-source="dataSource"
      argument-field="continent"
      value-field="area"
      line-color="#574f7d"
      :animation="true"
      :custom-value-label="getValueLabel"
      @point:click="onBarClick"
    />
  </div>
</template>

<script>
import { VcBarChart, VcLineChart } from 'vue-chartify'
export default {
  components: { VcBarChart, VcLineChart },
  data() {
    return {
      dataSource: [
        {
          continent: 'Europe',
          population: 740433713,
          area: 22134710,
          density: 33
        },
        {
          continent: 'Africa',
          population: 1460481772,
          area: 29648481,
          density: 49
        },
        {
          continent: 'South America',
          population: 439719009,
          area: 17461112,
          density: 25
        },
        {
          continent: 'North America',
          population: 604182517,
          area: 21330000,
          density: 28
        },
        {
          continent: 'Asia',
          population: 4753079726,
          area: 31033131,
          density: 153
        },
        {
          continent: 'Australia',
          population: 46004866,
          area: 8486460,
          density: 5
        },
        {
          continent: 'Antartica',
          population: 0,
          area: 13720000,
          density: 0
        }
      ]
    }
  },
  methods: {
    onBarClick(data) {
      console.log(data)
    },
    onPointClick(data) {
      console.log(data)
    },
    getValueLabel(value) {
      if (value > 0 && value < 1) {
        const precision = Math.ceil(-Math.log10(value))
        return value.toFixed(precision)
      }
      return value.toLocaleString()
    }
  }
}
</script>

<style lang="scss" scoped>
.bar-charts {
  display: flex;
  flex-direction: row;
}
</style>