View LIGO skymaps projected onto 3D celestial sphere!
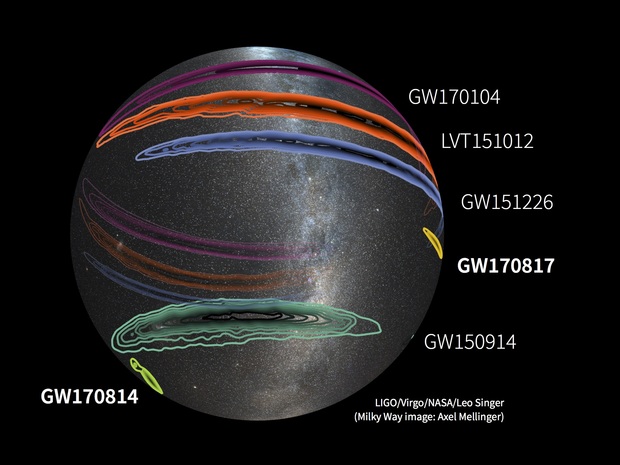
2D LIGO skymaps are a little bit difficult to physically intepret - at least I think so. If you've never seen a LIGO skymap (aka: banana plot), they are essentially 2D projections of a 3D map of the sky illustrating how well LIGO was able to localize a given gravitational wave (GW) event. Visualizing those projections as regions on the sky is something that I personally cannot do in my head. Which is why I though it would be useful to create a 3D skymap visualizer.
In its current state, the visualizer only displays images, but it's still a very useful tool for visualizing data which is difficult to render in 2D. It could be potentially useful and interesting to add functionality which would allow one to select coordinates on the celestial sphere and see what known objects are in the vicinity.
When LIGO detects a GW, the GW data is analysed using Bayesian parameter estimation techniques - which is just a complicated way of saying "we do some statistics to figure out sort of system produced the GW that we saw". The result of this analysis is a set of samples in all of the parameters that can be used to describe GW sources. The parameter space includes parameters which describe the sky location of GW source. By fitting to the density of the samples for these parameters, we can generate contours which describe the most likely sky location of the source.
All of the fits used to generate these contours was pre-computed in python using existing code for generating LIGO skymaps. The contour data was then saved to csv files to be used for dynamic contour plotting. Right now there are only three GW events to choose from; more will be added as data is processed.
Disclaimer: I am not even close to proficient in any of these languages/packages, so the code is a little hacky
The entirety of the code used to generate the contours is written in Javascript/html. I used the three.js
library to render all of the 3D elements and the gui, because it seemed like the best way to create an interactive,
web-based 3D visualiztion. The actual plotting of the contours is done dynamically using Plotly JavaScript Library.
I chose Plotly over D3 because it seemed a little more beginner friendly, and it has a ton of really useful plotting tools.
The 3D scene is composed of a set of 3 identically sized spheres - one for each display element - with a camera in the center. A skymap texture, the current contour plot, and a set of axes are rendered to the inner surface the spheres.
While the visulizer is running, one can adjust options on the gui to:
- view contours for different GW events
- change the contour confidence interval (CI)
- toggle right ascension/declination axes
Once any of the gui fields are changed, the scene re-renders. The contour plotting is set up to save an image to the
src/textures folder each time a new CI/event name combination is specified. If a plot of a given combination already
exists, the code will load that plot instead of generating a new one. Figuring out a good way to dynamically generate
and save images was definitely the most difficult part of this project; a lot of work went into making sure
the code was executed in the correct order so that everything rendered properly.
In order to run the visualizer, you will need to enable automatic downloads in your browser of choice, and
point the default save location to the src/textures folder contained in the repo. I realize this is
not the best way to do this, but hey it works.
Then, you should be able to initialize an http server in the main directory - which contains index.html -
and open the address to that server in a browser window. I use python -m http.server for initalizing
the server.