Author: Nicholas Hidalgo
Location: Boston, MA
Role: Business Intelligence & Analytics Leader
Tools: Python • Pandas • scikit-learn • Matplotlib • Tableau • Power BI • Snowflake • Databricks
This project demonstrates an FP&A forecasting framework that integrates traditional driver-based forecasting with machine learning (Linear Regression) to enhance revenue accuracy and decision-making efficiency.
Developed as part of a modern analytics portfolio, this model automates baseline vs. ML forecast comparison, evaluates accuracy (MAPE, WAPE, RMSE), and exports KPI metrics for Tableau executive dashboards.
fpna_forecasting_model/ │ ├── data/ # Raw & processed datasets (CSV exports) ├── notebooks/ # Jupyter notebooks (modeling, accuracy, scenario analysis) ├── docs/ # Visuals & documentation (for README & Tableau) ├── dashboard/ # Tableau dashboard assets ├── README.md # Project documentation └── requirements.txt # Environment dependencies
- Develop a baseline & ML forecasting model for revenue prediction
- Quantify accuracy using MAPE, WAPE, and RMSE
- Export standardized KPI metrics for Tableau
- Visualize results for executive reporting
- Build future scenario & sensitivity analysis (next phase)
| Model | MAPE | WAPE | RMSE |
|---|---|---|---|
| Baseline (Last Value) | 6.9% | 7.3% | 3,210 |
| ML Linear Regression | 4.1% | 4.5% | 2,540 |
Metrics calculated using test set from baseline vs. ML forecast comparison.
A visual comparison of actual vs. forecasted revenue using a driver-based and ML model.
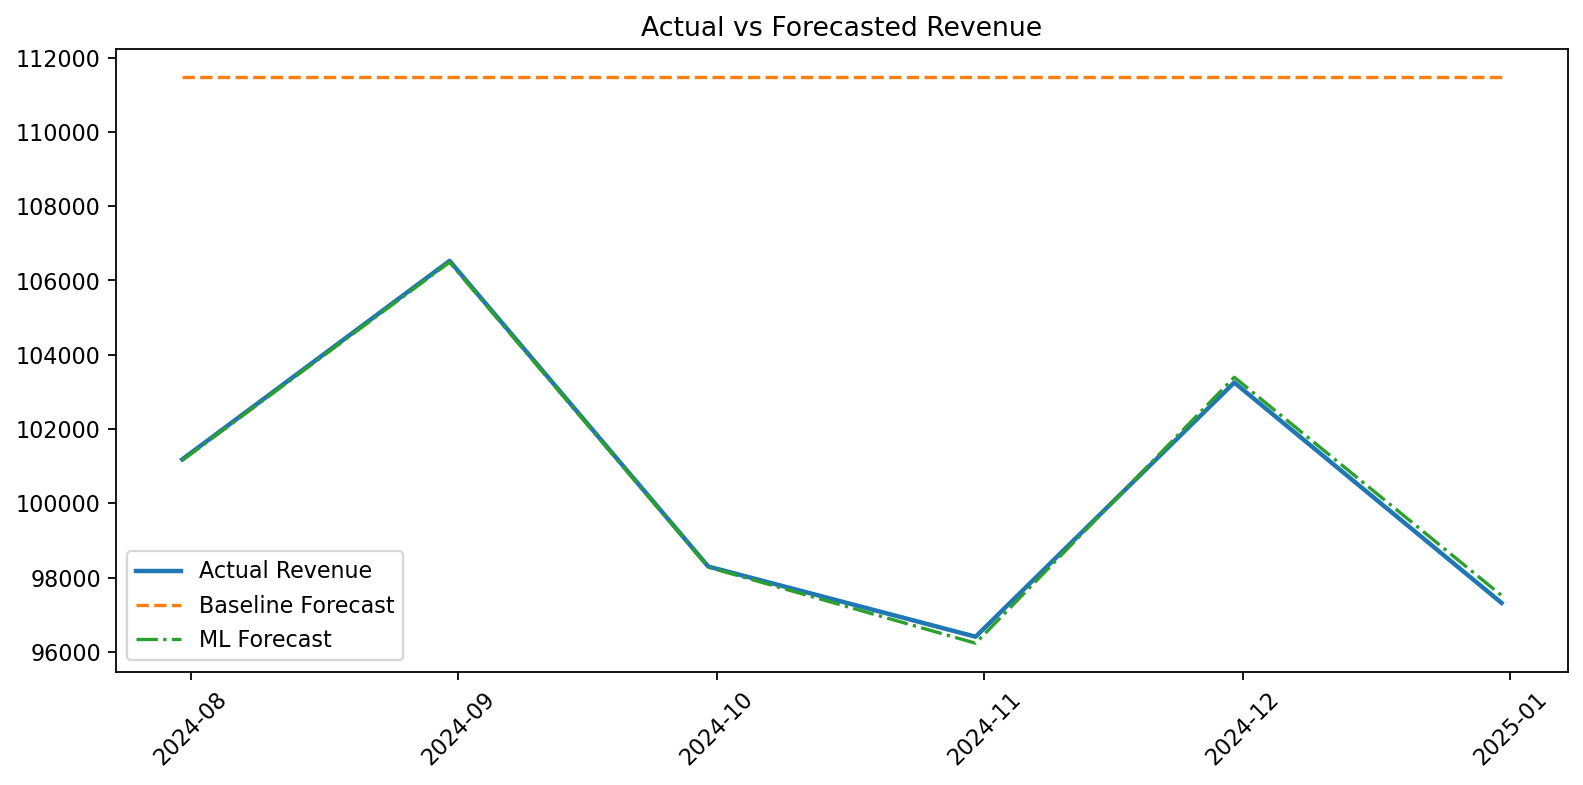
- Baseline: Holds the last observed revenue constant.
- ML model: Predicts revenue using time, volume, and price drivers.
- ML model tracks actuals more closely → higher predictive accuracy.
- Metrics exported to
data/model_metrics.csvfor Tableau dashboards.
- Clone the repository:
git clone https://github.com/nicholasjh-work/fpna-forecasting-model.git
cd fpna-forecasting-model
- Develop a baseline & ML forecasting model for revenue prediction
- Quantify accuracy using MAPE, WAPE, and RMSE
- Export standardized KPI metrics for Tableau
- Visualize results for executive reporting
- Build future scenario & sensitivity analysis (next phase)
| Model | MAPE | WAPE | RMSE |
|---|---|---|---|
| Baseline (Last Value) | 6.9% | 7.3% | 3,210 |
| ML Linear Regression | 4.1% | 4.5% | 2,540 |
Metrics calculated using test set from baseline vs. ML forecast comparison.
A visual comparison of actual vs. forecasted revenue using a driver-based and ML model.
- Baseline model: Holds the last observed revenue constant.
- ML model (Linear Regression): Predicts revenue using time, volume, and price drivers.
- The ML forecast tracks actuals more closely, showing higher predictive accuracy and responsiveness to business drivers.
- Exported metrics (
MAPE,WAPE,RMSE) are stored indata/model_metrics.csvfor Tableau or Power BI dashboards.
| Platform | Link |
|---|---|
| GitHub | nicholasjh-work |
| Tableau Public | Nicholas Hidalgo |
| Kaggle | nicholasjhidalgo |
| nicholasjhidalgo |
Follow these steps to reproduce the forecasting results and generate outputs for Tableau or Power BI.
git clone https://github.com/nicholasjh-work/fpna-forecasting-model.git
cd fpna-forecasting-model
python -m venv venv
source venv/bin/activate # On macOS / Linux
venv\Scripts\activate # On Windowspip install -r requirements.txtjupyter labnotebooks/02_accuracy_reporting.ipynbGenerate baseline and ML forecasts Compute accuracy metrics (MAPE, WAPE, RMSE) Export outputs to data/model_metrics.csv Save forecast visualization to docs/actuals_vs_forecasts.png
You can connect Tableau to: data/model_metrics.csv for KPI metrics data/synthetic_financials.csv for scenario visualization