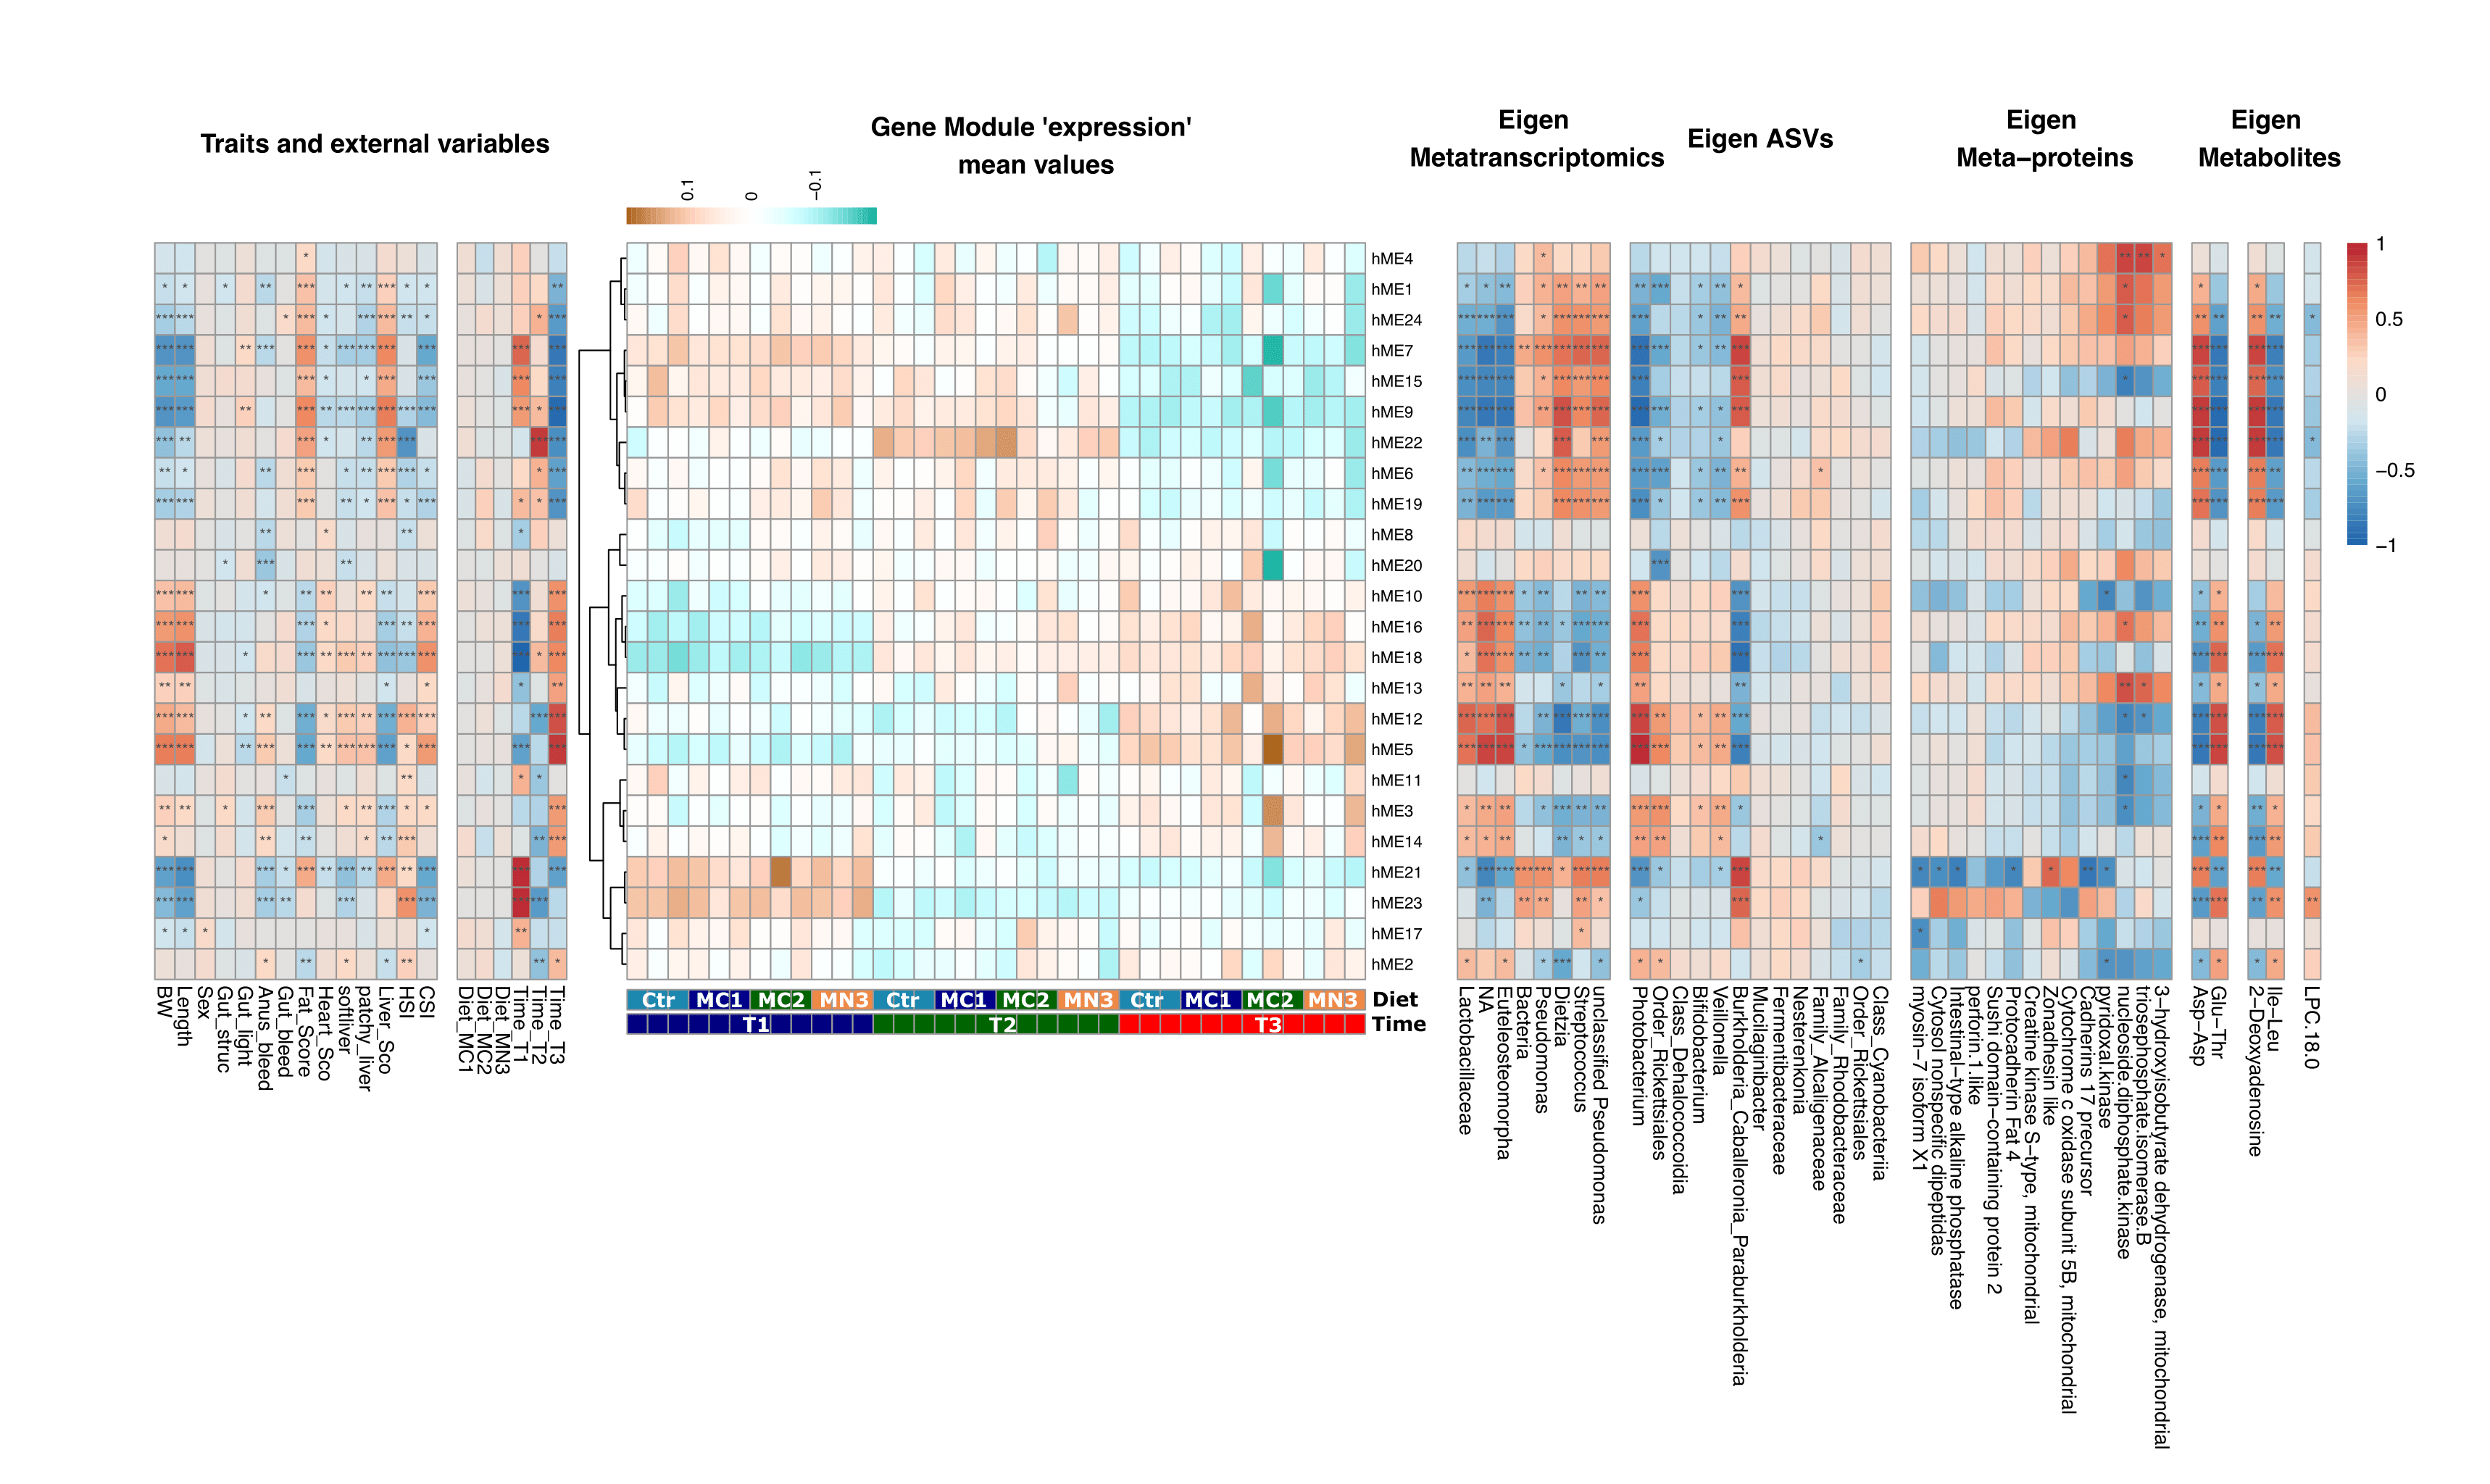
To meet future food demands, more efficient and sustainable animal production systems are needed. Given the crucial importance of the gut microbiota to animal (host) health and nutrition, selective enhancement of beneficial microbes via prebiotics may be a powerful approach for promoting farmed fish welfare and robustness. In this study, we employed three versions of a beta-mannan prebiotic that were fed to Atlantic salmon and explored the combined responses of both gut microbiota and the host from freshwater to seawater life stages. We have used weighted gene co-expression network analysis (WGCNA) of host RNA-seq and microbial 16S rRNA amplicon sequencing data to identify biological interactions between the gut ecosystem and the host. We observed several microbial and host modules through WGCNA that were significantly correlated with life stage, but not with diet. Microbial diversity was highest in the early life of Atlantic salmon and decreased over time. In particular, Lactobacillus and Paraburkholderia were the dominating genera and showed the highest correlation with host modules. Our findings demonstrate that salmon-microbiota interactions are mainly influenced by life stage, while further research is required to determine whether supplementation of selected prebiotics to diet can be used to modulate the salmon gut microbiota for improving host health and production sustainability.
Figure will be uploaded later.....

Installing R packages can be done through various sources such as GitHub, the Comprehensive R Archive Network (CRAN), or by following the official website of the package.
To install a package from GitHub, use the devtools package and the install_github() function. For example, to install the "ggplot2" package from GitHub, run the following code:
library(devtools)
install_github("ggplot2")
To install a package from CRAN, use the install.packages() function. For example, to install the "dplyr" package from CRAN, run the following code:
install.packages("dplyr")
Finally, to install a package from its official website, download the package source code, and use the install.packages() function with the local file path as the argument. For example, to install the "reshape2" package from its official website, first download the source code, then run the following code:
install.packages("path/to/reshape2_package.tar.gz", repos = NULL, type = "source")
It is recommended to regularly update the installed packages to ensure compatibility and to benefit from new features and bug fixes. We require following packages-
library("ranacapa")
library("phyloseq")
library("ggplot2")
library("stringr")
library("plyr")
library("reshape2")
library("reshape")
library("dplyr")
library("tidyr")
library("doBy")
library("plyr")
library("microbiome")
library("ggpubr")
library("vegan")
library("tidyverse")
library("magrittr")
library("cowplot")
library("dendextend")
library("WGCNA")
library("metagenomeSeq")
library("decontam")
library("RColorBrewer")
library("ampvis2")
library("DT)
library("png")
Primers were removed from the raw paired-end FASTQ files generated via MiSeq using “cutadapt”. Further, reads were analyzed by QIIME2 (qiime2-2021.8) pipeline through dada2 to infer the ASVs present and their relative abundances across the samples. For bed dust samples, using read quality scores for the dataset, forward and reverse reads were truncated at 280 bp and 260 bp, followed by trimming the 5′ end till 25 bp for both forward and reverse reads, respectively; other quality parameters used dada2 default values for both 16S rRNA gene sequencing. For 16S rRNA gene sequencing, taxonomy was assigned using a pre-trained Naïve Bayes classifier (Silva database, release 138, 99% ASV) were used.
The code is a shell script for processing paired-end sequencing data in order to perform a microbial analysis. It uses a combination of bash commands and QIIME2 (Quantitative Insights Into Microbial Ecology).
All downstream analyses were performed on this normalized ASVs table unless mentioned. We used two alpha diversity indices, i.e., observed richness and Shannon diversity index. Furthermore, beta diversity was calculated using weighted and unweighted UniFrac metric and visualized by principal coordinates analysis (PCoA). Alpha and beta diversity was calculated using phyloseq v1.38.0 and visualized with ggplot2 v3.3.5 in R v4.1.1. Comparison of community richness and diversity was assessed by the Kruskal-Wallis test between all the groups, and comparison between the two groups was done by Wilcoxon test with Benjamini-Hochberg FDR multiple test correction. Significance testing between the groups for beta diversity was assessed using permutational multivariate analysis of variance (PERMANOVA) using the “vegan” package.
For all the commands used for downstream analysis for metagenomics
For all the commands used for downstream analysis for gut transcriptomics
For all the commands used for downstream analysis for liver transcriptomics
For all the commands used for downstream analysis for metaproteomics
For all the commands used for downstream analysis for metabolomics. For Lipidomics, HILIC, RP
For all the commands used for downstream analysis for metatranscriptomics
For all the commands used for downstream analysis for gut omics-integration
For all the commands used for downstream analysis for liver omics-integration
To inform us of any bugs, please open a new issue or send us an email to shashank.gupta@nmbu.no